![]()
![]()
![]()
(based on Precious Woods 1995, 1996)
The case study was done with "Mil Madeireira Itacoatiara Company Ltd.", one of the local subsidiaries of Precious Woods Ltd., which is operating the F2M project near Manaus in the Amazonas-state in Brazil.
The Precious Woods Company Ltd. was founded in 1990 and acts as the group holding company financing sustainable forestry projects through majority holdings in local subsidiaries in the host countries or by transferring funds to these companies. Its purpose in particular is the reforestation of fallow land and the sustainable management of the existing natural forests in tropical countries.
 Figure 1. Location of F2M near Manaus (Precious Woods 1995) |
 Figure 2. F2M project area (Precious Woods 1995) |
The F2M project area is located about 227 km east of Manaus (3°S, 59°W) and extends almost 40 km along the Manaus-Itacoatiara highway and 20 km inland to the north (see Figures 1 and 2). Sawn wood is transported by truck to the river port of Itacoatiara on the Amazon River and further transport is by means of ships directly to Europe and the United States of America.
The F2M project covers a total area of 80 900 ha comprising the following areas:
| Production Forest Area | 52 200 ha | (64.5 %) |
| Preservation Forest Area | 23 200 ha | (28.7%) |
| Previously Deforested Area | 5 500 ha | (6.8 %) |
| Total F2M Project Area | 80 900 ha | (100.0 %) |
Apart from the deforested area, all areas are untouched and covered by primary forests, which are classified as the forest type of tropical moist forest on "terra firme" - subregion northwestern "Hileia" - Negro to Trombetas river (Schmidt 1989).
An area of 5000 ha in size, set aside to serve as a genetic pool, is located in the north-western part of the project area; the remaining preservation forest area of 18200 ha is formed by smaller areas irregularly distributed and embedded in the production forest area. These preservation areas are mostly slopes and low areas.
The deforested area, located in the south-eastern part of the project area along the state road, "Estrada da Varzea", to Silves, Itapiranga, and Nhamunda, was cleared several years ago for pasture purposes and is currently in the stage of secondary succession.
The forest management system described in the forest management plan is based on the "CELOS Management System" (de Graaf 1986). This system has been adapted and elaborated further by those responsible for the plan, N.R. de Graaf, C.A. Guerreiro, and R. de Camino. The adaptations made are mainly based on the local experiences of the INPA (Instituto Nacional de Pesquisas no Amazônia) and sampling techniques developed by EMBRAPA (EMpresa BRAsileira de Pesquisa Agropecuaria).
Basic information required on the primary forests of the project area was provided by a general forest inventory, which was conducted as a sampling inventory in 1993 by covering 0.1% of the total forest area. The results obtained for the entire forest area and principal tree species are stated in Table 1.
Table 1. Inventory result of F2M
| tree species | threshold | average volume |
| all tree species | dbh > 5 cm | 290 m³/ha |
| all tree species | dbh > 50 cm | 110 m³/ha |
| commercial species | dbh > 50 cm | 80 m³/ha |
Using present-day criteria, a list of all tree species considered to be of commercial interest can be found in Appendix 1, whereas Table 2 shows only the principal tree species of commercial interest.
Table 2. Principal tree species
common name |
scientific name |
Massaranduba |
(Manikara huberi) |
Louros |
(Ocotea spp., Mezilaurus spp.) |
Angelim |
(Hymenolobium spp., Dinizia spp.) |
Cardeiro |
(Scleronema micranthum) |
Cupiuba |
(Goupia glabra) |
Cumarú |
(Dipteryx oderata) |
Piquiá |
(Caryocar villosum) |
Tauari |
(Cariniana micrantha) |
Amapá |
(Brosimum parinarioides) |
Tachi |
(Sclerolobium spp.) |
Acaricuara |
(Minquartia guianensis) |
Breu vermelho |
(Protium altosonii) |
The general concept of sustainable management for the F2M project comprises the following measures:
· selective harvesting of up to 65 tree species of commercial interest;
· selective harvesting of an average of 35 m³/ha and a maximum of 40 m³/ha (about a half of the average harvestable volume per hectare found for the entire F2M forest area);
· selective harvesting of mature trees with a dbh > 50 cm;
· directional felling to diminish damage to residual trees and facilitate skidding operations;
· low impact extraction operations to minimise damage to residual stands;
· application of silvicultural treatments in order to stimulate tree growth of commercial tree species;
· harvesting cycle of 25 years;
· monitoring system of permanent sample plots for growth and yield assessment and evaluation of damage to the remaining stand as well as for research purposes.
The planned harvesting cycle is 25 years; therefore, the production forest area is divided into 25 annual operating areas of about 2000 ha production forest each. Since most of the project area is flat terrain, a regular grid is laid over the entire project area forming UTM blocks (4 km x 4 km). Each block has been subdivided into regular 10-ha plots (250 m x 400 m). These plots are to be considered the smallest forest management units, which will be referred to as "cutting units" throughout the report.
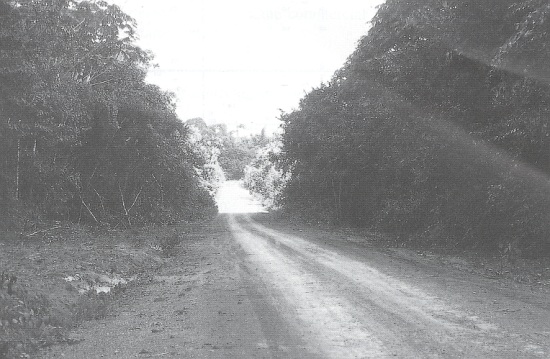
Photo 1. "Estrada da Varzea" - Forest access provided by public road
In 1993, when the project was started, forest access was provided only by the state road "Estrada da Varzea". Therefore the first annual operating area was located on both sides of this well-maintained dirt road. In 1995, access to parts of the second annual operating area was provided by building 6 km of forest road. Since harvesting operations were planned for the entire area of compartment B in 1996 an additional 14 kilometres of forest road had to be built.
The field studies on "environmentally sound forest harvesting" were carried out in compartment B, Block 312/9668, Plot G09, which will be referred to as cutting unit B/G09 throughout the report, and those on "traditional logging" were carried out in compartment B, Block 312/9668, Plot F09, which will be referred to as cutting unit B/F09. Commercial inventories including mapping of the cutting units (250 m x 400 m) were conducted before harvesting. In addition, potential crop inventories were carried out before harvesting commenced for selected areas (150 m x 150 m) within cutting units B/G09 and B/F09 which will be referred to as subplot B/G09 and subplot B/F09 throughout the report (see Figure 3 and 4).
Within the frame of the commercial preharvest survey all harvestable trees (commercial species with a dbh > 50 cm) have been identified, marked, counted, and dbh recorded as well as the tree's location drawn on the map of the cutting unit. For details on survey and tree mapping see chapter 3.2.

Figure 3. Tree location map of cutting unit B/G09 including skid trail layout
Figure 4. Tree location map of cutting unit B/F09
In conducting the potential crop inventory, the same procedure had been chosen for the potential crop trees (commercial species with a dbh > 20 cm), since those PCTs are most likely to form the projected harvest in the next harvesting cycle, assumed to be in 25 years.
The stand characteristics found by the commercial inventory for the adjacent cutting units B/G09 and B/F09 are stated in Table 3.
Table 3. Stand characteristics of adjacent study areas before harvesting
| Commercial inventory | ||||||
| Study area | size of area [ha] | volume [m³] | trees | tree species | volume/ha [m³/ha] | trees/ha |
| cutting unitB/G09 | 10 | 1100 | 219 | 41 | 110.0 | 21 |
| cutting unitB/F09 | 10 | 1263 | 236 | 39 | 126.3 | --- |
The stand characteristics found by commercial and potential crop inventory for subplots B/G09 and B/F09 are stated in table 4.
Table 4. Stand characteristics of subplot areas before harvesting
commercial inventory |
potential crop inventory | ||||||
study area |
size of area [ha] |
tree species |
volume/ha [m³/ha] |
trees/ha |
tree species |
volume/ha [m³/ha] |
trees/ha |
subplot B/G09 |
2.25 | 22 | 143.3 | 27 | 29 | 67.5 | 50 |
subplot B/F09 |
2.25 | 26 | 45.2 | 29 | 30 |
79.9 | 57 |
The values under volume per hectare of commercial species stated in Table 3 show the high variability in the harvestable volume in primary forests, not only compared to the average volume of 80 m³/ha found for the entire F2M forest area but also between adjacent cutting units. Even within a cutting unit the volume per hectare might differ considerably, as one can see by comparing the values found for subplots (see Table 4) to corresponding values stated in Table 3.
The high variability in harvestable volume and tree species distribution found indicates that particular attention must be paid to reliability of data provided by a general inventory. Especially since these data serve as a basis for setting the level of the annual allowable cut. The level of the AAC itself, which should provide the maximum harvest volume while ensuring that the prospects for future harvests do not deteriorate, will be decisive for whether the targets of sustainable forest management are met or not.
The results of the commercial inventory also underscore the importance of a comprehensive preharvest survey for each cutting unit comprising technical, topographic, economic, and ecological factors, since it is considered as the most important tool (Panzer 1991) in reducing logging waste.
The characteristics of timber removals by tree harvest from cutting units and subplots based on inventory data are stated in Table 5 and 6.
Table 5. Characteristics of timber harvest from study areas
| Commercial tree harvest | ||||||
| Study area | size of area [ha] | volume harvested [m³] | trees harvested | tree species harvested | volume harvested/ha [m³/ha] | trees harvested /ha |
| cutting unit B/G09 | 10 | 365.4 | 57 (+3) | 24 | 36.5 | 6 |
| cutting unit B/F09 | 10 | 927.0 | 164 | 32 | 92.7 | 16 |
( ) figure in parenthesis gives the number of PCTs harvested during skid trail opening
For the environmentally sound forest harvesting system, the timber removal amounted to 33% of the volume found by the commercial inventory prior to harvesting in cutting unit B/G09, which equals 26% of the trees of commercial interest. The corresponding figures for the traditional logging system are 73% for the volume and 69% for the trees of commercial interest.
Table 6. Characteristics of timber harvest from subplots
| Commercial tree harvest | Potential crop tree harvest | ||||||
| study area | size of area [ha] | volume harvested/ha [m³/ha] | trees harvested | trees harvested/ha | volume harvested/ha [m³/ha] | trees harvested | trees harvested/ha |
| subplot B/G09 | 2.25 | 38.5 | 10 | 4 | 1.9 | 3 | 1 |
subplot B/F09 |
2.25 | 114.6 | 52 | 23 | --- | --- | --- |
In the environmentally sound forest harvesting system several PCTs had to be removed in order to facilitate generally recommended straight alignment of skid trails (see also Dykstra & Heinrich 1996).
The information on PCTs provided by the potential crop inventory serves as a basis for the evaluation of potential future crops and for the assessment of damage to residual trees by forest harvesting operations.
![]()
![]()
![]()
![]()