![]()
![]()
![]()
3.1. The existing urban forest ecosystem
3.2. Potential for additional vegetation in the urban forest ecosystem of Quito
3.3. Functions of the urban forest ecosystem
In this section, the biophysical and social characteristics of the urban forest system will be examined, and the roles trees and vegetation are presently playing in Quito's urban socio-ecosystem will be discussed. The potential for additional urban vegetation and open space in the Quito Metropolitan District will then be assessed in light of present and projected spatial, demographic and environmental conditions of the city.
A great variety of vegetation types presently coexist in Quito, differentiated according to type and location of urban spaces, as well as human objectives for plant cover. Each area also possesses a distinct potential for the planting and maintenance of future vegetation.
All vegetation types within the urban and peri-urban zone are included here in the consideration of integrated management of the urban forest ecosystem in the Quito metropolitan area. Along with forest trees, fruit trees, ornamental trees and shrubs, herbaceous plants, grasses, flowers and food crops are also discussed. This approach is justified by the existence of shared social and ecological functions served by urban vegetation of whatever type, as well as the recognition of multiple existing and potential linkages among the human activities and practices related to each type of urban vegetation, including urban forestry, horticulture, landscape architecture, decorative gardening and urban agriculture.
The type, amount and location of vegetation within Quito, together with human-built elements of the city (buildings, service infrastructure, road system, etc.), combine to define the structure and composition of the urban forest ecosystem. These elements will be discussed separately for the urban core and peri-urban zones of the metropolitan area:
Urban Core Area
Trees: In 1990 and 1991, a detailed analysis and needs assessment was prepared for the urban forest of the Quito central city core (i.e., excluding the peri-urban parishes of the Metropolitan District), focusing only on woody vegetation (trees and bushes). This needs assessment was done as part of a larger ten-year urban forestry planning effort conducted by a local environmental group, Fundación Natura, in collaboration with the city Subdirection of Parks and Gardens.
This work collected a considerable amount of information regarding the existing urban forest and potential for urban trees in five different categories of urban space, which are described in more detail in Box 3.1 (also see Gangotena et al., 1990). These data have been updated and supplemented here with information provided from the author's own observations, interviews with employees of city government and Fundación Natura, as well as updated census information and land use documents from government agencies (INEC, 1990; IMQ, 1992a, b, c and d).
|
BOX 3.1: Typology of Urban Spaces for Forestry Applications In developing the methodology for the ten year Urban Forestry Plan for Quito, it became apparent that most differentiation in terms of the structure, composition and function of the urban forest was driven by differences in the type of urban space in which vegetation occurred. The research team therefore established a typology of urban spaces to help assess the status of the existing urban forest ecosystem, and permit quantification of future needs for vegetation throughout the urban core. The typology is based principally on the form and human uses of major urban elements within the city. Many considerations relevant to urban forestry are incorporated in the identification of the most common site types, including: · space limitations of the site type (both horizontal and vertical); Five major groupings of space were first identified for the consolidated urban portion of the city. These are: · Major Arterial Street Network Each of these general categories was in turn assigned several more refined subcategories, according to size, function, surface material, etc. of each space. The original categorization prepared for the Quito plan has been modified and expanded somewhat here, and a complete listing of 66 different site types is given in Appendix B. It should be noted that this typology applies only to the consolidated urban portion of the metropolitan area. A classification of spaces has yet to be developed for the peri-urban zone to assist in analysis of that forest system and guide plant species selection there. In the Quito urban forest planning process, the human-centered classifications resulting from this analysis were eventually used together with ecological information (climate, soil type, etc.) to match appropriate species to each type of urban space. An example of the tree species selection process using this typology is presented for the Quito urban core area in Appendix B. Source: Gangotena et al., 1991 |
Major findings on the state of the urban forest follow for each different "type" of urban space:
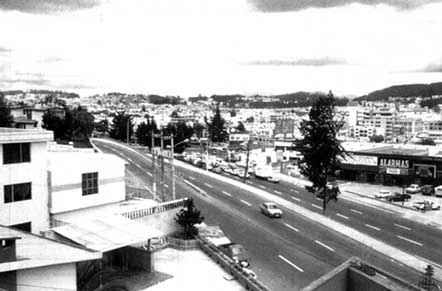
· Major Arterial Street Network (major avenues with medians, traffic circles and sidewalks) and Residential Street Network (smaller streets with sidewalks only)
Information on street tree stocking levels from 1983-1990 are presented in Tables 3.1 and 3.2. Since 1990, numerous new, young trees have been planted in medians and sidewalks on both major avenues and residential streets throughout the city. Although an exact number of additional trees planted since 1990 is not available, estimates range in the hundreds of thousands. Despite the high planting levels, mortality rates in this period have been very high. City staff estimated a 50% or greater mortality rate from 1990-1993 in the major arterial network (medians and sidewalks), and as much as 80-90% on residential street sidewalks, primarily due to the extremely small size of many of these trees (often < 30 cm. tall). This has improved to < 30% mortality in the last few years on major arterial street trees, since an effort has been made to plant larger stock (Torres, pers. comm., 1995).
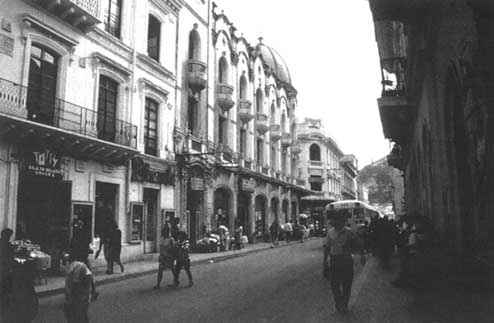
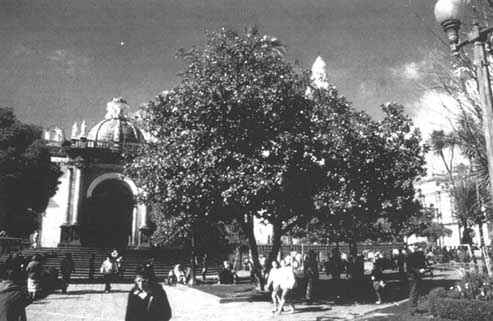
Photo 3.1.: View of street in colonial center of Quito. Note lack of space to plant street trees
There is fairly high diversity of tree species present on the medians and sidewalks of the major arterial and residential street networks. The 1990 street tree species distribution is presented in Table 3.3. The trees are predominantly exotic species at this time, although there has recently been a marked decrease in the production and planting of some of the most common introduced trees of the past, particularly pines (Pinus spp.), cypress (Cupressus macrocarpa), eucalyptus (Eucalyptus globulus), London plane (Platanus orientalis), and acacia (Acacia dealbata). A higher proportion of native species has been planted recently, along with additional exotics formerly found infrequently or not at all as street trees in Quito (although they may have been present in parks and private gardens). A full list of tree and bush species currently produced in city nurseries is found in Appendix C.
Table 3.1: Major Arterial and Residential Street Networks, 1990 Tree Stocking Levels
|
Location |
Total Street Length (Km) |
Number of Trees (1) |
Breakdown of Stocking Levels (3) |
Overall Stocking Level (%) |
||
|
Percentage of total with > 50% stocking level |
Percentage of total with 25-50% stocking level |
Percentage of total with 0-25% stocking level |
||||
|
Major arterial medians |
185 |
6019 |
29.5% |
27% |
43.5% |
34.6% |
|
Major arterial sidewalks |
364 |
1702 |
11% |
27% (with 1-50% stocking level) |
14% |
|
|
Residential sidewalks |
unknown |
5555 (estimated) (2) |
0% |
0% |
100% |
7% |
Source: Gangotena et al, 1990
1 includes trees one meter or more in height only2 extrapolating from sample "type" neighborhoods
3 for medians, based on maximum afforestation at an "ideal" spacing of 7.5 meters, and discounting 35% of the total street length for unusable space; for sidewalks on major avenues, based on a 7 m. ideal spacing; and for residential sidewalks, based on an ideal spacing of 14 m., and discounting various percentages of total street length, depending on specific neighborhood characteristics.
Table 3.2: Major Arterial Street Network, Change in Number of Trees, 1983-1990
|
Location |
Total New Trees Planted |
Total Previously Existing Trees Lost (1) |
Total Surviving New Trees Present(2) |
Average Surviving New Trees Per Year |
|
Medians |
unknown |
207 |
1666 |
238 |
|
Sidewalks |
unknown |
unknown |
996 |
142 |
Source: Gangotena et al., 1990
1 causes of death or removal are not recorded2 this figure includes trees encountered in newly expanded areas of urban development from 1983-1990
Table 3.3: Major Arterial and Residential Street Networks, 1990 Species Distribution
|
Species name |
Location |
|
|
Median |
Sidewalk |
|
|
Acacia dealbata (e) |
31.3 |
present |
|
Pinus radiata (e) |
23 |
rare |
|
Sauce humboldtiana (n) Sauce babylonica (e) |
8.2 |
present |
|
Inesa colenda (n) |
6 |
rare |
|
Eucalyptus globulus (e) |
5.8 |
rare |
|
Platanus orientalis (e) |
4.6 |
present |
|
Sambucus negro (n) |
3.5 |
present |
|
Cupressus macrocarpa (e) |
3.2 |
rare |
|
Populus alba (e) |
2.8 |
present |
|
Fraxinus excelsior (e) |
1.3 |
rare |
|
Juglans neotropica (n) |
0.6 |
rare |
|
Tecoma stans (n) |
0.4 |
present |
|
Ligustrum japonicum (e) |
0.2 |
present |
|
Callistemun citrinus (e) |
rare |
present |
|
Delostoma integrifolium (n) |
rare |
present |
|
Cassia canescens (n) |
rare |
present |
|
Magnolia grandiflora (e) |
rare |
present |
|
Hibiscus roseus (e) |
rare |
present |
|
Chionanthus pubenscens (n) |
rare |
present |
Source: Gangotena et al., 1990
Tree condition and health ranges from poor to good throughout the street network. The trees receive only sporadic maintenance, and many manifest a need for pruning or other care. In general residential street trees receive less maintenance than those on the major arterial network. In addition, the generally lower height of overhead power lines in residential neighborhoods has led to a much more serious problem of radical and generally destructive "pruning" of these trees by electrical utility workers. According to employees of the Subdirection of Parks and Gardens, pest problems are rare, although a few exotic species in the city have classically suffered from infestation problems of an unidentified kind, notably Platanus orientalis and Salix pirimidalis. In addition, vandalism and grazing damage is high, and very small trees (< 50 cm. tall) are often damaged or water stressed (Flores, pers. comm., 1995; Torres, pers. comm., 1995; Espinosa, pers. comm., 1995).
· Public Green Spaces (including neighborhood and metropolitan parks and vacant public lots)
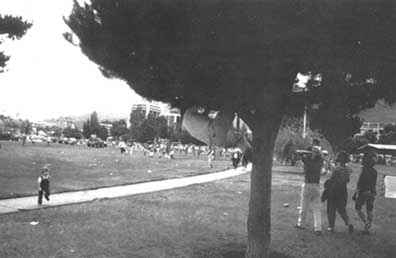
Information on total green space area and number of trees in public parks within the urban core of Quito is presented in Table 3.4. Within these averages, the higher income northern parts of the city have historically been the best served, while the southern and central zones have been much less so. In the early 1990s, a new, extensive open space area was added to the urban green space system as a major metropolitan park, the Bellavista Park. This park, located on the northeastern periphery of the city, more than doubled the total area of public green spaces for the city.
In addition to existing public parks, urban land use regulations in Quito require that every new housing development set aside a minimum of 10% of its land area for public open space. This requirement is not always stringently met, however. Even when land set-asides are made, these parcels are rarely actively vegetated or otherwise transformed into viable park spaces by private developers (although this, too, is required by law). No exact figure is available establishing the total additional green space area added to city holdings since 1990 by this or any other mechanism.
Tree species diversity is higher in parks than that encountered in the street tree population, although many of the most common species are the same as those listed in Table 3.3. As with street trees, species distribution is dominated by exotic ornamentals, with some recent moves to increase the proportion of native species represented. Tree condition is fair to good in most public parks in the city core, although as with the street network, maintenance received is minimal, and generally not preventive. Natural regeneration is non-existent in most urban parks in Quito. Some regeneration occurs in the woodland areas of Bellavista Metropolitan Park, although it has not been quantified precisely.
There is some municipal property within the city limits which is presently unoccupied and which might be developed as public parks. Officials of the City Department of Parks and Gardens are currently working with the municipal Direction of Assessment and Cadasters to determine the location, size and current condition of these parcels, and review their potential for eventual park use (Morales, pers. comm., 1996).
Table 3.4: Public Green Spaces in Quito (Urban Core Only), 1975-1993
|
|
International Standard |
1997 Municipal Plan Standard |
1975(1) |
1990 |
1993(3) (with Bellavista Park) |
||
|
Per inhabitant |
Per inhabitant |
Per inhabitant |
Total |
Per inhabitant |
Total |
Per inhabitant |
|
|
Open space area |
7-11 m2 |
7 m2 |
1.21m2 |
460 hectares |
4.2m |
1931 hectares |
9.41 m2 |
|
Number of trees |
N/A |
N/A |
unknown |
7550 (2) |
N/A |
57,100 (4) |
N/A |
Source: Gangotena et al., 1990; IMQ, 1994
(1) Figure includes all "recreational space" in the city, including paved and constructed facilities.(2) Figure extrapolated based on the average tree cover of a sample of different types of recreational open space in the city.
(3) Figure does not include either population growth since 1990, or required 10% green space set-aside in new housing development constructed from 1990-1993.
(4) Figure calculated by adding an estimated average existing tree cover of 100 trees/hectare of Bellavista Park; no additional urban park tree plantings from 1990-1993 are included in this figure.
· Private Property (including residential, commercial and institutional)
In 1991, 5,734 hectares of land were assigned to residential uses in the Quito urban core, representing about 47% of the occupied urban area (IMQ, 1992d). Exact figures do not exist on the area of non-residential private properties within the urban core (e.g. factories, businesses, hospitals, schools, etc.), or on the number of trees currently present in any of these spaces.
In 1990, an analysis of different types of private residential lots and their potential for afforestation was conducted by the Fundación Natura urban forestry planning team. No estimates were made, however, regarding current levels of tree planting in private yards in the city, or on other types of private property besides residential (e.g. commercial, institutional, etc.). The author has informally observed a medium to high presence of vegetation in most residential lots of the city, regardless of the socio-economic class of the neighborhood. The number of trees present seems most related to available space, but almost every yard of a single family dwelling has at least one tree. Other occupied private lots have a mixed level of landscaping, depending on the primary land use on the site.
Tree species present on private property in the city are extremely diverse, and include most of those found in public spaces within the city, as well as numerous others, many of them exotic ornamental plants. Tree condition on private lots tends to be good to excellent, as most people take very good care of their private yards or business properties. In middle and upper class neighborhoods, gardening is often done by a hired gardener. Natural regeneration of trees is probably rare or non-existent on occupied private lots of all kinds.
No information is available on the tree cover of vacant lands in private ownership, but casual observation indicates that there is a minimal presence of adult trees on these properties, which tend to be dominated by grasses, herbaceous plants or brushy vegetation.
· Special Protection Zones
The urban core of Quito contains special protection zones of four major land form/land cover types: elevated areas or hills, drainage ravines, riparian areas, and wooded zones. Each of these presents a series of possible conditions or projected uses which largely determine the type and amount of urban forestry appropriate. These generic conditions (applicable to all special zones) are presented in the Typology of Urban Spaces in Appendix B.
Important hill zones for protection in the central zone of the city include El Panecillo and Itchimbía. There has been some settlement on both of these hills, but significant green areas still remain where occasional afforestation or other park works have been implemented, representing a total available area of 90 hectares in El Panecillo and 33 hectares in Itchimbía. Tree planting campaigns with native species have occurred on El Panecillo (supported by the national Ministry of Agriculture and the Ministry of Education and Culture), but the survival rate of plants over the long-term has been only moderate. Information was unavailable on the total number of trees currently existing in these urban spaces. Natural regeneration of tree cover is unlikely to be significant because of the high numbers of domestic livestock grazing in the area.
Most drainage canals and natural ravines have been filled in during the course of Quito's development since colonial times, but those which remain intact are usually vegetated with both herbaceous plants and some woody bushes and trees.
The Río Machángara and the much smaller Río Grande (rivers) run directly through the Quito urban core for a total length of 9.5 km. and 3.5 km. respectively. River banks are currently in poor condition and water quality is low. No data exist on current levels of forest cover in riparian zones, but casual observation notes a low to moderate level of woody vegetation, virtually all of which occurs naturally and receives no management. The city Department of Parks and Gardens has historically not been involved in any significant way in the restoration of ravines or riparian areas within the city limits. In more recent years, however, several neighborhood-based initiatives (including some with municipal or NGO support) have been undertaken to clean out, revegetate and protect community ravine areas (Sáenz, pers. comm., 1995; ICLEI/IMQ, 1996).
The only major wooded area within city limits is Bellavista Park. Due to the newness of municipal presence in this area, little active tree planting has been conducted to date. Some forest management and enrichment planting are being planned for the near future, however, including the addition of significant new areas of native woody species.
There is no existing inventory of woody species in special protection zones of the city. It is known, however, that in the Bellavista Park the exotic forest species of Eucalyptus globulus and Pinus radiata dominate, although no information is available on the age-structure of these stands or natural regeneration rates. Urban ravines and riparian zones throughout the metropolitan area have at least some native species present in their less disturbed sections. Although no systematic survey of the flora exists in these spaces, native species such as Oreopanax ecuadorensis, Ainus jorullensis, Baccharis spp. and others are found.
The condition of forest vegetation is fair to good in most ecological protection zones. Pests have not been a major problem to date. Anthropogenic fire is a high risk in the densely wooded areas at the edge of the urban core and in some ravines, especially in the Bellavista Park area.
Other Vegetation: Virtually no quantitative information is available on the presence of other types of urban vegetation besides trees and bushes in the consolidated urban portion of Quito. Some general conclusions may be inferred from available documentation (Gangotena et al., 1990; IMQ, 1992d; Fundación Natura, 1987; Moore et al., 1984), as well as interviews with city employees and the author's personal experience:
The needs assessment for the Quito Urban Forestry Plan (see above) estimated that in 1990 a total of 460 hectares of publicly owned "green space" or vacant area was present within Quito, most of which has been designated for park uses. Added to this is the recent inclusion of the 571 hectare Bellavista Park into the urban green space system, yielding a total of 1031 hectares of public open space within the urban core.
In order to obtain an estimate of the total surface area potentially covered by non-woody vegetation in public parks, it is necessary to discount from this total the surface area of paved and constructed areas, as well as the area currently occupied by trees. In 1990, on the original 460 hectares of public open space, an average of 16.4 trees per hectare was estimated to exist by the urban forestry planning team (in a range from a minimum of 14 to a maximum of 50 trees/hectare encountered in the sample). Calculating from a conservative maximum density possible of 150 adult trees per hectare 3, this would leave at least 89% of the total territory, or 409 hectares of public property not currently occupied by trees or permanent constructions. Applying the same formula, in the Bellavista Park stocking levels are considerably higher than in other green spaces, and probably reach an average of 100 trees per hectare, thereby leaving an estimated 190 hectares of territory covered by non-tree vegetation. Therefore, in total, there may be as many as 599 hectares of public urban green space in Quito covered by some other vegetation than trees (Note: these estimates do not account for understory vegetation occupying the same space as trees in wooded areas).
3 The 150 trees/hectare maximum density was derived taking an average possible maximum of 200 mature trees common in rural forest plantations in Ecuador, and discounting about 25% of the total land area to account for other park land uses which preempt future tree planting, such as roads, paths, pavement and other constructed elements such as basketball courts, playgrounds, etc. This maximum tree density is not in any way meant to suggest that this is an optimum forest density or land use distribution in an urban park setting; rather, it merely accounts for the amount of space potentially occupied by an "average" adult tree at the expense of other vegetation.
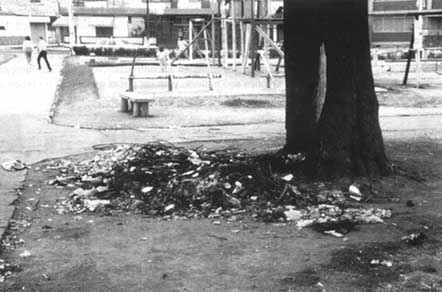
Photo 3.9: Garbage and vandalism around a tree in an urban park
No estimates were made in the 1990 urban forestry study regarding the percentage of tree cover presently existing on private lots of all types within the urban core. However, extrapolating from 1980 figures given on average lot size and constructed area by zone, it may be estimated that in 1990, there was a total of 2580 hectares of plantable space (i.e., not covered by houses or other constructions) within the private residential lots of the city 4. If a conservative 30% of this unconstructed land is considered to be without tree cover, this would leave at least 1721 hectares of free residential yard space not covered by trees or buildings.
4 This estimate was generated by applying a gross estimate of the average percentage of non-built space in private lots of 55% (city data on various type lots range from 30% to 70% free space, with 50-60% most common (Gangotena et al, 1990).
As mentioned above, in addition to the above occupied land (both public and private), land use data from the city Planning Department indicates that an additional 27% of the total land area within the urbanized core area of the city, or a little over 10,000 hectares (mostly privately held), is currently totally undeveloped.
Of the above estimated total of over 12,300 hectares of land of all types within the urban core not currently under tree cover (public and private, occupied and unoccupied), some small portion is completely unvegetated (i.e., dirt or cement surface), but the majority appears to be covered by some kind of plant. The three major types of non-tree vegetation encountered in these spaces include:
· Grasses and Herbaceous Vegetation: Most areas of Quito have a favourable enough climate and soil conditions to permit the spontaneous growth of weedy plants if left undisturbed. This consists primarily of grasses and small herbaceous plants, as well as some brush species. Informal observation reveals that exotic kikuyo grass (Pennisetum clandestinum) is the dominant ground cover colonizing unbuilt areas, vacant lots, roadsides, unattended green spaces, etc. In addition, kikuyo grass cover is frequently intentionally planted as a lawn in public parks as well as in private lots of all types (residential, institutional, etc.). This species is extremely hardy and invasive, spreads vegetatively with ease, and tolerates harsh urban conditions well. Besides kikuyo, other weedy plants are also present in the city, although no list of specific species found is available. Not all grasses and herbaceous plants found in urban spaces are weeds, however, and in the few remaining unfilled ravines and riparian areas throughout the city, some native herbaceous species are also still found.
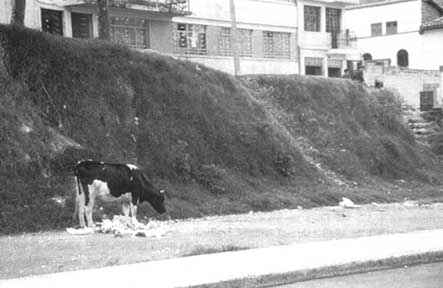
Photo 3.10: Grazing on a vacant area at road edge in urban core
· Cultivated Ornamentals: Ornamental plants (flowers and ground covers) are quite common in public green spaces, especially on the medians of major avenues, traffic circles, and in parks. As with trees, no detailed inventory exists of these plants, although it is known that me largest of the two city nurseries (Las Cuadras-Chillogallo) produces more than 70,000 ornamental plants per year for placement in public green spaces (Flores, pers. comm., 1995). There are 45 species of both annuals and perennials produced, virtually all exotic. The other nursery (Guayllabamba) has an annual production of approximately 60,000 non-woody ornamental plants, including over 25 exotic and native species (Hernández, pers. comm., 1995). A list of the ornamental species currently produced by the municipality appears in Appendix C.
On occupied private lands, a considerable quantity of flowers and other ornamentals are planted in housing lots, especially in the middle and upper class residential neighborhoods, but almost every private yard regardless of neighborhood or socio-economic class has some ornamental plant growing there. Institutional and commercial properties also generally include ornamental plants in their landscaping efforts, although small home-based industries or workshops often don't have the space for such plants. Quantification of these privately cared for plants, or a list of specific species planted are not available.
Vacant, unoccupied lands within the urban core, regardless of ownership, generally do not have ornamental plants growing on them, except those which may have spread by natural regeneration.
· Agriculture: Next to no systematic information exists on the type, quantity, location or producers of urban agriculture within the city core of Quito. However, the practice is commonly observed throughout the city in private yards as well as wherever unused land is available, regardless of legal ownership. The type and frequency of food crops tend to vary according to socio-economic class and lot size, with fruit tree cultivation one of the only types of urban agriculture practised by those in the highest income strata in the urbanized portion of the city. In middle class and older lower class neighborhoods, trees with edible fruits and nuts are also common on private house lots. In less consolidated neighborhoods in the periphery of the urbanized core, cultivated vegetable crops are also frequently seen, but even in middle class neighborhoods, public and private vacant lots and road edges will sometimes be planted with short-term vegetable crops such as corn. These opportunistic plantings are presumably undertaken by lower-income residents, but no hard data exist to substantiate this. Also, information is not available on whether permission is usually obtained from private landowners to utilize vacant lots for agricultural purposes.
Domestic livestock including pigs, chickens, cows, sheep, as well as smaller animals such as guinea pigs and rabbits, are also present even within the .urban core area of Quito. Larger animals such as cows and pigs are mainly housed in residences in the peripheral neighborhoods of the metropolitan area, but are often seen even in the most consolidated central sectors of the city, grazing on the grass and weeds of medians and other vacant public and private spaces.
It is unknown to what extent urban household agriculture is practised for subsistence versus for commercial production. The generally small lot sizes in the more consolidated core of the city probably preclude significant commercial production levels. However, some families (especially in informal settlements at the city edge) either own or use additional vacant lots which they dedicate to agricultural cultivation, or make informal use of public spaces for crops or animal grazing, both practices creating a greater possibility for commercial production.
As a final note on non-tree vegetation in the central urban zone, it is worth mentioning that information on urban vegetation on public properties within the urban core area may improve over time. The Director of the Design section of the Subdirection of Parks and Gardens has begun a detailed inventory of public green spaces of Quito. This work not only includes an accounting of the type and location of trees present, but also documents the total area of grass area, flowers and other ornamental plants in public green spaces of all types. Unfortunately, because it is an informal initiative outside of the regular duties of this work unit, progress will be relatively slow in completing this study (Morales, pers. comm., 1995).
· Peri-Urban Area
No detailed inventory data exists on trees or vegetation of any type in the zones of the metropolitan district outside the urbanized core area of Quito. However, some overall land cover data may be gleaned from inventories conducted by the Quito municipal Planning Department which include the rural parish zones of the Metropolitan District. In addition, a few different land use and vegetation surveys were conducted in the early 1980s for various parcels of the protected greenbelt surrounding the city, prepared by the Ministry of Agriculture and consultants to U.S. AID (MAG-DINAF, 1987; Moore et al., 1984). Finally, a study exists on changes in land use in the Quito Metropolitan area between 1980 and 1986, based on review of aerial photography over this time period (Fundación Natura-CLIRSEN-IMQ, 1987).
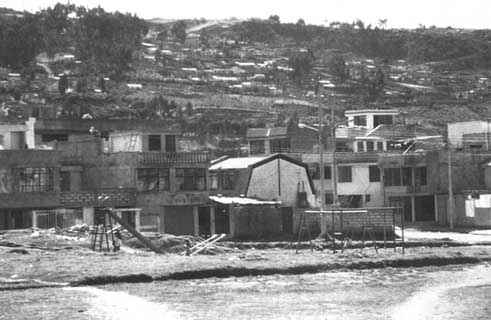
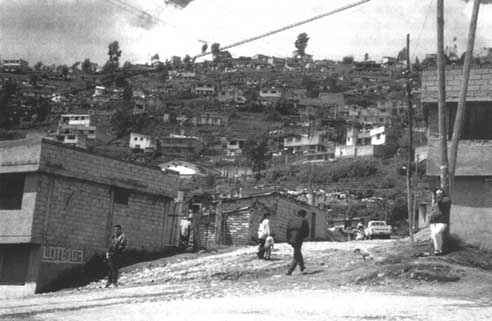
Photo 3.11: Spontaneous housing settlements in peri- urban areas
Land Cover: Table 3.5 presents data from the municipal Planning Department which gives the breakdown of land cover and land uses in the rural parishes of the city (Table 3.5) (IMQ, 1992d).
As can be seen from these data, less than 4% of the total land area in the zones surrounding Quito is considered urbanized. Data from the municipal Department of Public Works reveal that there are 36 urban public parks in the peri-urban zone (an average of one central park per town). However, no tree or other vegetation survey has ever been carried out on these spaces, so little is known about number, species, condition, of trees and other plants present. No information is available on publicly planted and cared for street trees either, but these are not commonly found in peri-urban towns. An exception are the medians of major access roads and highways leading into some parish seats, which at times have trees and bushes planted on them (Jimenez, 1995).
Table 3.5: Land Cover and Land Use in the Peri-Urban Parishes of the Quito Metropolitan District, 1991
|
Land use type |
Hectares |
% of total |
|
Pasture land |
41,858.59 |
16.50 |
|
Cultivated land |
23,959.39 |
9.40 |
|
Cultivated forests |
2,788.05 |
1.10 |
|
Natural vegetation |
81,523.50 |
32.00 |
|
Bodies of water |
91.44 |
0.03 |
|
Ravines |
22,288.11 |
8.80 |
|
Bedrock/mineral surface |
726.13 |
0.28 |
|
Protected areas |
71,043.26 |
28.00 |
|
Urbanized area |
9,356.95 |
3.70 |
|
Undescribed areas |
19.89 |
.01 |
|
Total area |
253,655.32 |
100.00 |
Source: IMQ, l992d
More significant from the perspective of the urban forest ecosystem is the 96% of non-urbanized land in the peri-urban zone, of which approximately 150,130 hectares (59% of the total) is explicitly categorized as non-protected lands covered by some sort of vegetation. Of these zones, natural vegetation areas (i.e., those areas without significant human intervention) are by far the most highly represented (32% of the total surface area, 54% of the total vegetated zones), followed by pasture grasslands (32% of the total surface area, 54% of the vegetated areas) and cultivated agriculture (9.4% of the total, 16% of vegetated areas). Less prevalent, but still significant, a total of 2,788 hectares is classified as cultivated forest (1.1% of the total, 1.8% of the vegetated lands). Only 23,105 hectares (9% of the total area) is covered by various natural land cover types which preclude any type of plant cover at all (e.g., bodies of water, rock outcrops, etc.).
In addition to these figures, it can be assumed that a considerable proportion of the over 71,000 hectares of protected area listed is also characterized by some kind of vegetative cover, at least in the lower and middle altitude zones 5. Unfortunately, detailed (and somewhat outdated) data on the protected areas are only available for that portion comprised by the roughly 30,025 hectares of Protected Forest and Vegetation directly contiguous to the urban core. In 1984, a U.S. AID-funded planning team summarized land use in the then existing 8,334 hectare Pichincha Protected Forest and Vegetation area (Bosque Protector Pichincha), which constitutes most of the western edge of the urban greenbelt 6 . In addition, in 1987, the Ministry of Agriculture estimated land uses for eight parcels making up an additional 21,929 hectare portion of the legally designated metropolitan protected zone, located on the north, east and south edges of the city core. Similar to the figures provided by the city Planning Department for non-protected lands, natural vegetation formations (páramo and shrublands) were also the most common vegetative cover type found in protected parcels, followed by pasture land, cultivated agriculture and forest plantations. These data are consolidated and summarized in Table 3.6:7
5 There is some inconsistency in the municipal data sets. In this table, 71,043 hectares are identified as "protected zones", where other information provided in more recent municipal documents states that a total of 86,440 hectares of protected areas exists in the metropolitan area (for example, see Metzger and Bermúdez, 1996).6 This zone was the original block of land declared for protection in 1983. The original area has recently been reduced to 8096 hectares by the Municipality, a reflection of land lost to illegal urbanization activity taking place at the margins of the protected area.
7 As mentioned in an earlier section of this report, the legal designation of "Protected Forests and Vegetation" applies to both public and private lands, and "non-destructive" productive activities may be allowed under this protected status.
Table 3.6: Land Use in the Designated Protected Forests and Vegetation Zones Immediately Surrounding Quito, 1984 and 1987
|
Land use type |
Bosque protector pichincha |
Eight additional parcels |
Total |
|||
|
Hectares |
% |
Hectares |
% |
Hectares |
% |
|
|
Pasture land |
2,585 |
31.0 |
9,590 |
44 |
12,175 |
40.2 |
|
Agriculture (cultivated) |
1,161 |
13.9 |
4,429 |
20 |
5,590 |
18.5 |
|
Agriculture and pasture |
N/A |
N/A |
1,513 |
7 |
1,513 |
5.0 |
|
Artificial forests (plantations) |
1,561 |
18.7 |
3,681 |
17 |
5,242 |
17.3 |
|
Shrub land |
863 |
10.4 |
2,257 |
10 |
3,120 |
10.3 |
|
Páramo (highland grassland) |
2,164 |
26.0 |
459 |
2 |
2,623 |
8.7 |
|
Total area |
8,334 |
100 |
21,929 |
100 |
30,263 |
100 |
Sources: Moore et al., 1984; MAG-DINAF, 1987
In considering all of the above information on land cover and land uses in the Quito metropolitan region, it is important to keep in mind the extremely dynamic nature of the peri-urban zone, and the continuing tendency towards more urban land uses occurring throughout the area. In 1986, a study was conducted by Fundación Natura, along with experts from a remote sensing project sponsored by the French government (ORSTOM), an Ecuadorian government remote sensing research institute (CLIRSEN), and the Municipality of Quito. This project sought to measure changes in land use in the urban area of Quito over the period 1980-1986. Specifically designed to document the spread of urbanized land uses into declared protected lands and agricultural zones of the metropolitan area, the study found that:
· 18,254 hectares within the metropolitan area experienced some modification of vegetative cover incompatible with the original use (especially in protected or agricultural areas); however, these changes were considered reversible, and land restoration was still possible as of 1986.· In addition, 3,258 hectares of land underwent serious, irreversible change in both vegetative cover and alteration of topography. These hectares were virtually all outside the limits of the consolidated urban core, and 2,115 hectares of the total were within designated protected areas.
· 1,051 hectares of protected areas in the metropolitan area were found to be in active agricultural or housing land uses at the end of the study period, i.e., in the process of urbanization.
· Despite the clear trend of outward spread of urban land uses, at the end of the study period, there were still 9,126 hectares of vacant land within the urban area (Fundación Natura/CLIRSEN/IMQ, 1987).
No comparative study has been done to quantify additional changes in land use since 1986, but the urbanization trends found above have continued virtually unabated to the present day. 8
8 A collaborative research project between the French research organism ORSTOM and the Municipality of Quito is the process of examining these continuing land use changes in the urban fabric for the period 1986-1990 (Metzger, 1995)
Plant Species: In general, the original vegetation of the lower elevations of the peri-urban area has been substantially altered by human activities, even in the less developed or protected portions of the metropolitan area. Although detailed species surveys do not exist, research conducted in the mid-1980s identified several non-food crop plant species in the protected ecological zones of the District (see list in Appendix C), including both woody and herbaceous species, natives and exotics. Many of these are also found in non-protected status lands in the area. In addition, some general information on plants found within different land cover types follows:
· Urbanized Areas: Vegetation in the urbanized areas (i.e., town parks, streets, and private properties) is mainly the product of human intervention, and is similar in species make-up to that found in the central city core. As already mentioned, however, this plant cover is of relatively minor importance in terms of ecological or social functions in comparison with other types of vegetation in the peri-urban zone.· Cultivated Agricultural Areas: Since colonial times, cultivated agriculture has displaced much of the original native forest and grassland vegetation of the lower elevations of the zone (below 3200 m.). As parcel sizes tend to be larger than in the city core, more commercial scale production occurs in the peri-urban zone. In addition to short-cycle food crops such as corn, broad beans, barley, fruit trees, potatoes and other tubers, dairy and livestock operations are an important agricultural activity. Speciality crops such as flowers for the export market (e.g. carnations, babies' breath, roses, etc.) are also a significant agricultural product in Quito's peri-urban zone.
· Pasture Land: In pasture land, some native grasses do occur, but exotics such as rye (Lolium perenne) and bluegrass (Poa pratensis) are also common. In addition, intensive grazing of domestic livestock (cattle and sheep) and management practices such as frequent burning of pasture have resulted in a very manipulated and non-native species mix in these grassland areas.
· Forest Lands: Where dense forest stands still exist, they are generally monocultures of the introduced plantation species Eucalyptus spp. (primarily E. globulus) and Pinus spp. (primarily P. radiata), both of which are timber species. The few remaining remnants of native woody vegetative cover are largely restricted to ravines and other inaccessible areas, often at higher elevations.
· Undisturbed Zones: The upland zones of the peri-urban area are often fairly undisturbed by humans, and are covered by natural vegetation. Several common páramo species are encountered here, many of which are listed in the plant inventory information for protected zones provided in Appendix C.
Quito is far from being a cement jungle and currently possesses a significant urban forest resource, but room for improvement exists in many areas. This section will focus on the potential for additional vegetation of many types in the urban and peri-urban zones of the metropolitan area. As in prior sections of this report, the discussion of potential will be handled separately for the urban core and the peri-urban areas.
It should be noted that a vegetation-maximizing scenario is presented here as a point of departure for discussion of urban forestry "potential". The desirability of actually achieving this level of vegetation cover will need to be carefully considered in light of all social and ecological opportunities and constraints in Quito, many of which are discussed in more detail in Section 4 of this study.
For some areas of the city, the analysis will specify the number, species and location where new plants could potentially be planted in the Quito context. Where such quantification is not possible, the potential for expanding certain ecological and social functions of urban vegetation will be explored.
Box 3.2. Functions of the Urban Forest Ecosystem in the Quito - Urban Core Area
Urban Core Area
In 1990, as part of the planning process for urban forestry in the Quito city core, general estimates were made of the number of trees necessary to attain maximum tree cover levels in the city through the year 2000. No estimates were made for any other type of urban vegetation. Table 3.7 below summarizes these estimated tree "deficits" in all types of urban spaces. The same study also attempted to develop estimates of the production levels needed for different species of trees and bushes in order to meet these goals, as a function of ecological life zone, as well as type of planting site. Those estimates were translated into an initial action plan for use by the municipal nursery of the city, and included over 80 species of trees and bushes, and recommended an average annual production of between 100,000-200,000 plants between 1990-1993 (Gangotena et al., 1991). A complete list of the species considered in this planning process, according to ecological zone and planting site is presented in Appendix B.
Table 3.7: Estimated Deficit of Trees in the Quito Urban Core Area, 1990-2000
|
Type of planting site |
Existing trees 1990 |
Estimated deficit 1990 |
Estimated deficit 2000 |
|
Major arterial network |
8,520 |
38,206 |
74,000 |
|
Residential street network |
5,555 |
147,044 |
241.672 |
|
Public green spaces |
7,550 |
36,258 |
69,379 |
|
Private properties |
unknown |
217,643 |
344,682 |
|
Ecological zones |
unknown |
85,619 |
135,595 |
|
Total |
unknown |
546,395 |
865,328 |
Source: Gangotena et al., 1990
The initial needs assessment prepared concluded that the city could have accommodated over 546,000 new trees as of 1990, and over 865,000 through the end of the century. Subsequent meetings with city officials suggested reducing this estimate by about 10%, especially regarding potential additional trees on private property, to a revised amount of about 779,000 new trees for the end of this decade. Further, since the urban forestry planning process was completed in 1991, a significant number of new trees has already been planted throughout the urban core, possibly approaching 300,000 trees, although the exact number of surviving trees is much less. Assuming a conservative (although not unrealistic) survival rate of 25% overall of these trees, the number of total trees which still could be added by the year 2000 would be around 704.000.9
9 based on a 10-20% survival rate for the majority of the trees planted in the years 1990-93, and a 70% survival rate for many fewer trees during 1994-95.
Peri-Urban Area
No quantified estimates have been made for the potential for new vegetation of any type in the peri-urban zone of Quito. As mentioned above, however, for these outlying zones (as well as for non-tree vegetation within the urban core), qualitative observations may be made on potentially underdeveloped functions of trees and plants of all kinds. These are discussed in more detail in the following section.
The literature on the functions and benefits of urban forests in general is extensive, and need not be repeated in detail here (Moll and Ebenreck, 1989; Gangloff, 1995). Each city is unique, however, and the relative importance of each function of the urban forest ecosystem differs among distinct sectors of the Quito metropolitan area, and for one type of vegetation versus another.
The following analysis is designed to help Quito decision-makers identify current benefits and drawbacks of vegetation in the urban socio-ecosystem, and highlight the potential for human action in the urban forest in the future. First, urban plants are considered in light of the "functions" they serve in the city environment. These functions have been arbitrarily defined as either "ecological" or "social", although there are many cases of overlap between the two. Ecological functions refer here to those which would operate in any forest ecosystem, without the significant intervention of humans. 10 Social functions are those with a direct and immediate utility to humans, and often with a more direct human role in managing the function. These have been divided into three different classes:
10 Although the fact that they have been singled out here indicates that some human value is assigned to them.· commodity production (e.g. wood products, food, energy);
· environmental services (e.g., air quality, water supply, natural disaster prevention); and
· other human amenities and services (e.g., recreation, aesthetics, community organization).
Boxes 3.2 and 3.3 provide a qualitative assessment of both the "current" and "potential" impacts of a vegetation maximizing alternative on each of these social and ecological functions of urban vegetation in the urban and peri-urban zones of Quito. Both positive and negative impacts are provided, to highlight the costs and benefits of this alternative.
It is important to recognize that in Quito, as elsewhere, there is sometimes a disparity between the actual impacts of urban vegetation (both positive and negative) for each function, and what those impacts are generally perceived to be by the public at large 11. These disparities matter because they may influence the effectiveness of programmes put in place to increase positive impacts or decrease negative impacts of urban vegetation. As such, public perceptions of the role of vegetation in the city form a critical component of urban vegetation "potential" itself.
11 Although a dominant public perception can be described, it is recognized that the "public" of Quito is highly . heterogeneous in its levels of awareness and attitudes towards urban vegetation (based on income, geographic location, gender, age, etc.). Some of these internal differences are discussed in more detail in Section 4 of this report.
In general, the actual impacts of most of the ecological functions of urban vegetation are highest in the peri-urban zones, with social functions playing an important role in both urban core and outlying areas. In both places, public perception of positive impacts tends to equal or be less than what is actually occurring in most cases. The reverse may be true in the case of air quality improvement, biological diversity or natural disaster prevention, where exaggerated claims are often made for the role played by urban and peri-urban vegetation. In general, the public perceives few or no negative impacts of urban or peri-urban vegetation, with the possible exception of some exotic tree species like Eucalyptus spp. or Pinus spp., which are currently in disfavour among certain citizen groups, or in the case of inappropriate urban and peri-urban forestry or agricultural practices leading to excessive soil erosion or water contamination with agricultural chemicals. Also, the urban core public views the common peri-urban practice of burning pasture land for animal grazing as extremely negative.
Box 3.3. Functions of the Urban Forest Ecosystem in Quito - Peri-Urban Area
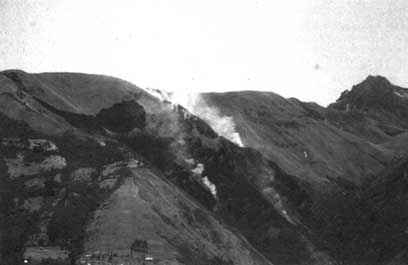
Photo 3.13: Forest fire in peri-urban agricultural areas and woodlands
Finally, it should be emphasized that the analysis presented is necessarily general at this time, since there is a total lack of quantitative data available on the social or ecological roles played by plants in Quito (actual, perceived or potential). The general assessments which are given of current ecological and social functions are based on municipal and private environmental planning documents, the Quito urban forestry plan, interviews with local forestry professionals, city staff, environmental advocates and neighborhood residents, and several years of personal observation on the part of the author (Metzger and Bermúdez, 1996; CODIGEM, 1993; Gangotena et al., 1990 and 1991; IMQ, 1992f; SISHILAD, 1996; Cobo, pers. comm., 1995; Zea, pers. comm., 1995). Additional impacts have been inferred from existing studies on urban areas in other parts of the world, which share many of the same biophysical characteristics of the urban built environment as Quito.
Likewise, many of these same sources provide the basis for assessing the type and extent of public "perceptions" of urban forest functions in the urban core and peri-urban area of Quito. Additional information on public attitudes was also gleaned from promotional and educational materials for urban forestry (produced by both local NGOs and municipal agencies), a review of several years of local press accounts, and interviews with city park employees, staff of the Pichincha Protected Forest, and community residents involved in neighborhood tree planting campaigns (Murray, 1992, 1993, 1996a and 1996b; Cobo, pers. comm., 1995; Yánez, pers. comm., 1995; Kuenzel, pers. comm., 1995; Quingalombo, pers. comm., 1996; Barreto, pers. comm., 1995; Galindo, pers. comm., 1994).
![]()
![]()
![]()