![]()
![]()
![]()
Roundwood
Sawnwood
Wood-based Panels
Paper and Paperboard
Comparison with the Recent FAO World Outlook for Forest Products
The Asia-Pacific Forest Products model was applied to make preliminary forecasts for the period of 1993 to 2010, based on the assumptions outlined above. After these forecasts are reviewed, better forecasts may be prepared by altering the assumptions and/or introducing constraints on specific variables.
Consumption of roundwood in the Asia-Pacific will continue to rise, as rapidly growing economies are concentrated in the region. Forecast shows that consumption in the region will grow from 1,161 million m3 to 1,232 million in the year 2000 and 1,353 million in 2010, an increase of 11% and 20% (Figure 17). The Asia-Pacific region should account for 35% of world-wide consumption of roundwood in the year 2010, up slightly from 33% in 1992. Fuelwood and charcoal will continue to take a large share of total roundwood, but decline from 72% in 1992 to 69% in the year 2010.
Figure 17. Roundwood consumption in the Asia-Pacific region and the world, 1962-2010.
Figure 18 shows historical and forecast trends for industrial roundwood prices in 1992 US dollars at the world level. Price of industrial roundwood remained roughly stable, in real terms, in the world until the early 1970s. Between the mid-1970s and the mid-1980s, the world price of industrial roundwood fluctuated and reached a second peak in 1979/80, at almost the same level as 1974. Since then the price started declining and by 1986 the "gain" of the late 1970s were entirely lost, and the price around 1992 ($93/m3) was even slightly lower than that of the early 1960s ($101/m3). The price outlook indicates that the price of industrial roundwood world-wide will steadily increase over the next twenty years, and is expected to nearly double by the year 2010.
Use of fuelwood and charcoal has been and will still be the dominant use of wood in the developing countries of the Asia-Pacific region. Total consumption is projected to be 870 million cubic meters by the year 2000 and 930 million by 2010, 7% and 19% over the 1992's level. By the year 2000, the top three consuming countries will still be India (268 million cubic meters), China (212 million) and Indonesia (165 million) (Table 85).
Figure 18. Real world price for industrial roundwood, 1962-2010.
In Japan, New Zealand, Australia and Hong Kong, income increase is expected to have negative effect on fuelwood and charcoal demand. As a result, their consumption in 2010 will be lower than current consumption.
Historically, most countries in the Asia-Pacific region were largely self-sufficient in fuelwood and charcoal, and imports and exports were negligible. It is expected that the situation will continue in the future. Thus, demand and supply will be basically balanced in every country and territory in the coming years. Therefore, the forecasts were made under the assumption that there would be no international trade in fuelwood and charcoal.
Consumption of industrial roundwood in the Asia-Pacific region is expected to rise from 320 million m3 in 1992 to 361 million in the year 2000 and 422 million in 2010 (Table 86). This represents an annual increase of 2.3% between 1992 and 2000 and 1.6% for the 2000-2010 period, around the 1.8% growth for the 1982-92 period but lower than the 3.0% growth during the period of 1962-92. The Asia-Pacific region's share of the world's total will rise from 20% in 1992 to 22% in the year 2000 and 23% in 2010, reflecting a faster growth in consumption than the world average in the next two decades.
Table 85. Consumption of fuelwood and charcoal, in thousand m3, 1992-2010.
|
Country |
1992 |
2000 |
2010 |
|
Australia |
2974 |
2291 |
1720 |
|
China |
203765 |
212060 |
222905 |
|
Hong Kong |
289 |
123 |
76 |
|
India |
257789 |
268283 |
282003 |
|
Indonesia |
145455 |
165138 |
184411 |
|
Japan |
856 |
269 |
201 |
|
Korea Rep |
4491 |
4674 |
4913 |
|
Malaysia |
9029 |
10605 |
11916 |
|
Myanmar |
18632 |
20716 |
22859 |
|
New Zealand |
50 |
37 |
27 |
|
Papua New Guinea |
5533 |
5649 |
5941 |
|
Philippines |
35035 |
37899 |
41350 |
|
Singapore |
|
|
|
|
Solomon Islands |
138 |
140 |
145 |
|
Thailand |
34859 |
39765 |
44503 |
|
Rest of the Asia-Pacific |
122256 |
99618 |
107421 |
|
Asia Pacific |
841151 |
867267 |
930388 |
|
Canada |
6867 |
5644 |
4264 |
|
Chile |
7999 |
9010 |
9907 |
|
European Union |
36845 |
31563 |
23988 |
|
Russia |
81051 |
78800 |
81977 |
|
United States |
93246 |
75472 |
58531 |
|
Rest of the World |
806171 |
893690 |
943514 |
|
World |
1873330 |
1961445 |
2052569 |
|
Share |
45 % |
44% |
45% |
Table 86. Consumption of industrial roundwood, in thousand m3, 1992-2010.
|
Country |
1992 |
2000 |
2010 |
|
Australia |
10147 |
11932 |
15869 |
|
China |
98531 |
96309 |
122494 |
|
Hong Kong |
390 |
183 |
428 |
|
India |
25306 |
25651 |
26331 |
|
Indonesia |
38876 |
46303 |
56495 |
|
Japan |
75086 |
103793 |
115360 |
|
Korea Rep |
12123 |
12139 |
14187 |
|
Malaysia |
26896 |
29449 |
30244 |
|
Myanmar |
2949 |
1098 |
1533 |
|
New Zealand |
10029 |
9716 |
9736 |
|
Papua New Guinea |
646 |
488 |
523 |
|
Philippines |
4159 |
4129 |
4747 |
|
Singapore |
-99 |
1726 |
2488 |
|
Solomon Islands |
-184 |
0 |
0 |
|
Thailand |
4505 |
4109 |
4970 |
|
Rest of the Asia-Pacific |
10659 |
14190 |
16954 |
|
Asia Pacific |
320019 |
361216 |
422357 |
|
Canada |
177851 |
180313 |
185725 |
|
Chile |
13647 |
12501 |
11245 |
|
European Union |
224516 |
260800 |
284683 |
|
Russia |
244204 |
205956 |
223909 |
|
United States |
376858 |
391693 |
404988 |
|
Rest of the World |
243375 |
252255 |
315890 |
|
World |
1600470 |
1664733 |
1848796 |
|
Share |
20% |
22% |
23% |
Most countries within the region are expected to increase their domestic consumption of industrial roundwood over the next twenty years. Among them, China, Japan and Indonesia will remain the top three consumers. China's consumption will increase from 99 million m3 in 1992 to 122 million in 2010. Consumption of industrial roundwood in Japan is projected to rise nearly 41% between 1992 and 2010, from 75 million m3 to 115 million (Figure 19). The increase in consumption will most likely occur in the wood-based panels and paper and paperboard sectors. Similar to China, Indonesia will also experience a faster growth period, and increase its industrial roundwood consumption by the year 2010. Other than these three countries, Malaysia and India will also be important consumers of industrial roundwood in the Asia-Pacific region by the year 2010.
To meet the increasing requirements, the production of industrial round in the Asia-Pacific region is projected to rise, from 288 million m3 in 1992 to 368 million in 2010 (Table 87). The region's world share will be up slightly from 18% in 1992 to 19% in the year 2000 and 20% in 2010.
Table 87. Production of industrial roundwood, in thousand m3, 1992-2010.
|
Country |
1992 |
2000 |
2010 |
|
Australia |
16552 |
18944 |
23615 |
|
China |
92792 |
94000 |
121000 |
|
Hong Kong |
488 |
571 |
695 |
|
India |
24570 |
25500 |
26300 |
|
Indonesia |
39351 |
46215 |
56501 |
|
Japan |
27736 |
29016 |
31296 |
|
Korea Rep |
1994 |
1905 |
1799 |
|
Malaysia |
44851 |
47333 |
47947 |
|
Myanmar |
4101 |
4813 |
5878 |
|
New Zealand |
14992 |
20423 |
25434 |
|
Papua New Guinea |
2655 |
2668 |
3021 |
|
Philippines |
3614 |
4042 |
4650 |
|
Singapore |
|
|
|
|
Solomon Islands |
330 |
396 |
496 |
|
Thailand |
2736 |
2932 |
3779 |
|
Rest of the Asia-Pacific |
11207 |
13131 |
16006 |
|
Asia Pacific |
287969 |
311888 |
368416 |
|
Canada |
179215 |
183708 |
189483 |
|
Chile |
17774 |
20260 |
23863 |
|
European Union |
208541 |
241316 |
266563 |
|
Russia |
256000 |
217208 |
236321 |
|
United States |
402500 |
412591 |
425561 |
|
Rest of the World |
251377 |
277762 |
338590 |
|
World |
1603376 |
1664733 |
1848796 |
|
Share |
18% |
19% |
20% |
China will remain the largest producer of industrial roundwood in the region by the year 2010. China is expected to be largely self-sufficient in wood supply, and production is forecast to increase from 93 million m3 to 121 million in 2010. Over the same period, Indonesia will become the second largest supplier of industrial roundwood in the Asia-Pacific region, with 46 million m3 in the year 2000 and 57 million in 2010, which represents 18% and 43% increases over the 1992 levels. Malaysia will be the third largest supplier, with 47 and 48 million m3 in 2000 and 2010 respectively. Those forecasts are higher than the projections of 17 million in the year 2000 and 20 million in 2010 made by Jaakko Poyry (1992), and 24 million in the year 2000 and 25 million in 2010 suggested by Simons Reid Collins (1995).
According to the Indonesia government's 5-year development plan (Repelita V) outlined in 1988, the target of annual wood harvesting would be 42 million m3 by the mid-1990s, moreover, the recent FAO study entitled "Situation and Outlook of the Forestry Sector in Indonesia" estimated that wood supply would decline from 39 to about 28 million m3 between 1990 and 2010 by continuing traditional operations, but would increase to 50 million by the year 2000 and 60 million in 2010 under the development scenario, and would increase to 50 million by the year 2000 and nearly 80 million in 2010 under the intensive development scenario (Jaakko Poyry 1992). Therefore, the present forecast is consistent with the development scenario.
Figure 19. Japanese production and consumption of industrial roundwood, 1962-2010.
In this forecast, Japan is also one of the top suppliers of industrial roundwood within the Asia-Pacific region. Its production increases from 28 million m3 in 1992 to 29 million in 2000 and 31 million in 2010 (Table 87). As shown in Figure 19, Japan's domestic production of industrial roundwood fell from a peak over 52 million m3 in 1967 to about 28 million in 1992, and currently accounts for only 37% of the country total industrial roundwood consumption. Past analysts of Japanese domestic timber supply have speculated the potential of an "age of domestic timber", wherein Japan steps-up timber harvest volumes from its expanding plantations to meet an increasing share of domestic demand. However, this has not occurred, due in part to the stable supply on global wood markets and the high wages and labour intensity associated with Japanese forestry (CINTRAFOR, 1994). The supply potential of Japan's plantation forests has been estimated at nearly 66 million m3 per year if managed for maximum biological yield, which is well over twice that of current production level. If such an increase can be realized, Japan could virtually eliminate its dependence on wood imports. In a 1987 study the ministry of Agriculture, Forests and Fisheries predicted that Japan's domestic production of industrial roundwood could be 45-52 million m3 by 2004 (CINTRAFOR, 1994). In that case, the present forecasts would be plausible.
For the Republic of Korea, it is forecast that domestic production of industrial roundwood would drop slightly between 1992 and 2010.
Table 88 shows imports of industrial roundwood by country and territory, between 1992 and 2010. The total imports by countries in the Asia-Pacific region are expected to rise from 68 million m3 in 1992 to 94 million in 2000 and 105 million in 2010. But the expansion of imports would be first faster then slower with an average annual growth rate of 2.6% between 1992 and 2000 and 1.1% between 2000 and 2010, compared to 1.9% from 1982 to 1992. The region's world share will increase from 70% in 1992 to 76% in 2010.
Table 88. Imports of industrial roundwood, in thousand m3, 1992-2010.
|
Country |
1992 |
2000 |
2010 |
|
Australia |
7 |
0 |
0 |
|
China |
6442 |
3475 |
2425 |
|
Hong Kong |
488 |
182 |
413 |
|
India |
739 |
151 |
31 |
|
Indonesia |
78 |
574 |
530 |
|
Japan |
47380 |
74777 |
84064 |
|
Korea Rep |
10135 |
10234 |
12388 |
|
Malaysia |
10 |
17 |
107 |
|
Myanmar |
0 |
0 |
0 |
|
New Zealand |
11 |
13 |
38 |
|
Papua New Guinea |
|
|
|
|
Philippines |
550 |
90 |
104 |
|
Singapore |
70 |
1726 |
2488 |
|
Solomon Islands |
|
125 |
66 |
|
Thailand |
1794 |
1177 |
1192 |
|
Rest of the Asia-Pacific |
608 |
1059 |
948 |
|
Asia Pacific |
68312 |
93602 |
104793 |
|
Canada |
2420 |
588 |
560 |
|
Chile |
1 |
|
|
|
European Union |
21385 |
22503 |
21498 |
|
Russia |
24 |
0 |
0 |
|
United States |
1503 |
2138 |
2331 |
|
Rest of the World |
3723 |
5347 |
8747 |
|
World |
97341 |
124178 |
137929 |
|
Share |
70% |
75% |
76% |
Japan, the Republic of Korea and Singapore will be the top three importers in the Asia-Pacific region over the next two decades. Of the three countries, Japan and Singapore will be the countries which will have higher rising rate of imports of industrial roundwood, while the Republic of Korea's imports will increase slower. With the projected rising consumption, Japan's imports of industrial roundwood are expected to grow from 47 million m3 in 1992 to 75 million in 2000 and 84 million in 2010, despite the increasing domestic production. And the share of imports in total consumption will increase from 63% in 1992 to 72% in 2000 and 73% in 2010.
The Republic of Korea's imports of industrial roundwood is forecast to stay at the current level of 10-12 million m3 for the next twenty years.
China would further reduce its imports of industrial roundwood in the future, from 6.4 million m3 in 1992 to 2.4 million by the year 2010, accounting for about 2% of total consumption. This declining trend in imports seems reasonable, as China's sawnwood consumption has decreased since the late 1980s, and imports of wood-based panels and paper products have risen sharply, moreover. China's ministry of Forestry has recently included the development of new plantations to provide fibre sources for wood pulping in its ninth "Five Years Planning", and set a goal of increasing woodpulp and paper production capacity from the current level of 350 thousand metric tons to one million metric tons by the year 2000 and three million metric tons by 2010 (Chinese ministry of Forestry 1994).
Table 89. Exports of industrial roundwood, in thousand m3,1992-2010.
|
Country |
1992 |
2000 |
2010 |
|
Australia |
6412 |
7013 |
7746 |
|
China |
703 |
1166 |
931 |
|
Hong Kong |
98 |
570 |
680 |
|
India |
3 |
|
|
|
Indonesia |
553 |
486 |
537 |
|
Japan |
30 |
|
|
|
Korea Rep |
6 |
|
|
|
Malaysia |
17965 |
17901 |
17810 |
|
Myanmar |
1152 |
3715 |
4346 |
|
New Zealand |
4974 |
10720 |
15735 |
|
Papua New Guinea |
2009 |
2180 |
2498 |
|
Philippines |
5 |
3 |
7 |
|
Singapore |
169 |
|
|
|
Solomon Islands |
514 |
521 |
562 |
|
Thailand |
25 |
|
|
|
Rest of the Asia-Pacific |
516 |
|
|
|
Asia Pacific |
35134 |
44274 |
50852 |
|
Canada |
3784 |
3983 |
4319 |
|
Chile |
4128 |
7760 |
12618 |
|
European Union |
2068 |
3019 |
3377 |
|
Russia |
11820 |
11253 |
12412 |
|
United States |
27145 |
23036 |
22904 |
|
Rest of the World |
12853 |
30854 |
31446 |
|
World |
96932 |
124178 |
137929 |
|
Share |
36% |
36% |
37% |
As shown in Table 89, the exports of industrial roundwood by countries in the Asia-Pacific region are projected to increase moderately from 35 million m3 in 1992 to 44 and 52 million in the years 2000 and 2010. The region's share of the world total exports would increase to 37% by 2010. The largest exporters in the region are, ranked by volume, Malaysia (18 million m3), New Zealand (16 million), Australia (8 million), Myanmar (4 million), Papua New Guinea (2.5 million), and China (0.9 million).
The projected direction of trade in industrial roundwood within the Asia-Pacific region and between Asia-Pacific and other countries and territories in 2010 are shown in Table 90. Countries of the Asia-Pacific region are expected to import 100 million m3 of industrial roundwood, and around 46% will be intra-regional trade and the rest 54% will come from other countries and territories.
Table 90. Direction of trade in industrial roundwood, in thousand m3, 2010.
Japan will still lead all countries in import in 2010 with 84 million m3, nearly 43% of which from countries within the region, and 57% from other parts of the world. Figure 20 shows Japanese imports of industrial roundwood from 1962 to 2010. It is expected that Japanese imports will increase 78% from 1992 to 2010, and more than the domestic supply of industrial roundwood. The United States (16.3 million m3) is likely to continue to be the principal supplier of Japanese wood markets, followed by New Zealand (13.2 million), Malaysia (12.2 million), Chile (10.9 million), Australia (7.7 million), Russia (5.3 million), and Canada (2.2 million).
Figure 20. Japanese imports of industrial roundwood, 1962-2010.
While the Asia-Pacific exports will continue to go to countries in the same region, primarily to Japan, exports to other regions will rise, accounting for 6% by the year 2010. Malaysia is forecast to remain the single largest exporter of industrial roundwood in the region, and New Zealand, Australia, Myanmar, Papua New Guinea, and even China are all expected to gain in their global market shares.
Figure 21 shows the Asia-Pacific region and world's consumption of sawnwood and sleepers for the period 1962 to 2010. Over the last three decades, the rate of growth in sawnwood world-wide has been slow partly due to substitution by other wood and non-wood materials. Among the products substituting for sawnwood, especially in developed countries, are wood-based panel products - plywood, particle board and fibreboard, which have grown fast in the last three decades (see Tables 40, 45 and 50).
Figure 21. Sawnwood consumption in the Asia-Pacific region and the world, 1962-2010.
During the next twenty years, global sawnwood consumption should continue to grow, although at a reduced rate. The Asia-Pacific region's consumption of sawnwood is projected to increase from 105 million m3 in 1992 to 125 million in the year 2010. This is an average annual growth rate of only 1.1%, slower than the last thirty years' average of 3.2%. Hardwood's share should increase from 48% in 1992 to 53% in the year 2010, as a result of increasing non-coniferous sawnwood production and static coniferous sawnwood production. The Asia-Pacific region's share of the world's total consumption is expected to rise from 24% in 1992 to 26% by the year 2010.
The 1992 percentage distribution of the region's consumption is: coniferous sawnwood - 52% and non-coniferous sawnwood - 48%. By the year 2010, this distribution will be reversed to: coniferous sawnwood - 47% and non-coniferous sawnwood - 53% (Figure 21).
The world prices for sawnwood, in 1992 US dollar, are shown in Figure 22. Historically, prices for softwood and hardwood sawnwood have been parallel, with hardwood prices growing slightly faster than softwood prices. This trend is likely to continue over the next two decades. The softwood price is projected to go up from $170 in 1992 to $302 in 2010, while the hardwood price will increase from $362 to $594/m3.
Figure 22. Real world price of sawnwood, 1962-2010.
Although India, China and Indonesia will have sizeable increases in their sawnwood consumption, Japan should still be the leading consumer in the region. As shown in Figure 23, Japan's consumption of sawnwood should continue to grow towards the year 2010, although at a reduced rate compared to the last ten years. The level of consumption is projected to rise from 38 million m3 in 1992 to 40 million m3 in 2010.
Japan should remain a net importer of sawnwood, as the projected production would increase from about 28 million m3 in 1992 to 33 million in 2010 (Figure 23). The imports will account for nearly 20% of Japan's consumption by 2010, drop from 27% in 1992.
Figure 23. Japanese sawnwood production and consumption, 1962-2010.
Coniferous sawnwood consumption in the Asia-pacific region is expected to still be 55 million m3 by the year 2000 and reach 59 million m3 by the year 2010, up 11 % in 2010 from 1992's level (Table 91). The region's share of the world's total will remain stable, 20% over the same period. By the year 2010, Japan (35 million m3) and China (13 million) will continue to lead other countries in the region, and the combined consumption of the two countries will account for 81 % of the total coniferous sawnwood consumption in the region, increasing slightly from 80% in 1992.
The softwood share of sawnwood consumption in Japan is expected to remain 87% in 2010. Figure 24 shows the past and future trends in Japanese coniferous sawnwood consumption, which resembles the development of total sawnwood consumption in Figure 23.
Total production of coniferous sawnwood in the Asia-Pacific region is forecast to increase from 46 million m3 in 1992 to 53 million m3 in 2010, and meanwhile its world share would increase slightly from 15% to 16% (Table 92). While its production will increase gradually, Japan is expected to remain the largest producer of coniferous sawnwood in the Asia-Pacific, with 28 million m3 in 2010. Besides Japan, another top producer will be China, with 11 million m3 in the year 2010.
Table 91. Consumption of coniferous sawnwood, in thousand m3, 1992-2010.
|
Country |
1992 |
2000 |
2010 |
|
Australia |
2578 |
2918 |
3157 |
|
China |
11780 |
10611 |
12718 |
|
Hong Kong |
-3 |
|
|
|
India |
2502 |
1938 |
1726 |
|
Indonesia |
111 |
127 |
158 |
|
Japan |
32853 |
33473 |
34890 |
|
Korea Rep |
2846 |
3148 |
3572 |
|
Malaysia |
-11 |
|
|
|
Myanmar |
|
|
|
|
New Zealand |
1573 |
1763 |
1926 |
|
Papua New Guinea |
43 |
38 |
41 |
|
Philippines |
5 |
4 |
4 |
|
Singapore |
22 |
13 |
15 |
|
Solomon Islands |
|
|
|
|
Thailand |
|
|
|
|
Rest of the Asia-Pacific |
761 |
705 |
832 |
|
Asia Pacific |
55060 |
54738 |
59038 |
|
Canada |
11164 |
10403 |
11232 |
|
Chile |
1757 |
1964 |
2157 |
|
European Union |
58103 |
59196 |
64682 |
|
Russia |
48959 |
39870 |
42332 |
|
United States |
106294 |
106384 |
114070 |
|
Rest of the World |
34049 |
25976 |
29252 |
|
World |
315386 |
298531 |
322762 |
|
Share |
18% |
18% |
18% |
Figure 24. Coniferous sawnwood production and consumption in Japan, 1962-2010.
Table 92. Production of coniferous sawnwood, in thousand m3, 1992-2010.
|
Country |
1992 |
2000 |
2010 |
|
Australia |
1558 |
2354 |
3022 |
|
China |
11452 |
9856 |
11459 |
|
Hong Kong |
|
|
|
|
India |
2500 |
1935 |
1716 |
|
Indonesia |
138 |
127 |
157 |
|
Japan |
24423 |
26944 |
27962 |
|
Korea Rep |
2810 |
2934 |
3259 |
|
Malaysia |
69 |
77 |
56 |
|
Myanmar |
|
|
|
|
New Zealand |
2465 |
2899 |
3262 |
|
Papua New Guinea |
43 |
38 |
41 |
|
Philippines |
4 |
2 |
0 |
|
Singapore |
|
|
|
|
Solomon Islands |
|
|
|
|
Thailand |
|
|
|
|
Rest of The Asia-Pacific |
925 |
1370 |
2238 |
|
Asia Pacific |
46387 |
48536 |
53172 |
|
Canada |
55512 |
57058 |
68729 |
|
Chile |
2582 |
2612 |
2609 |
|
European Union |
52326 |
57051 |
66737 |
|
Russia |
52000 |
41963 |
43867 |
|
United States |
80972 |
72532 |
70744 |
|
Rest of the World |
31207 |
18781 |
16906 |
|
World |
320986 |
298532 |
322764 |
|
Share |
15% |
16% |
16% |
The Asia-Pacific region's imports are expected to remain the same level between 1992 and 2010. The region's share of the world's total, in turn, would decrease from 17% in 1992 to 13% by the year 2010. The largest importers of softwood lumber in the region in 2010 would be Japan (7 million m3) and China (1.3 million). The combined imports of the two countries are expected to account for more than 80% of the region's total. Imports of coniferous sawnwood in Australia are expected to fall from over one million m3 to 0.5 million between 1992 and 2010 (Table 93).
Instead, the region's exports of coniferous sawnwood are expected to grow but remain small level, accounting for 5% of the global exports in 2010. New Zealand will continue to dominate other countries within the region in exports. It is expected that New Zealand's coniferous sawnwood exports will increase from slightly less than 1 million m3 in 1992 to close to about 1.3 million by the year 2010. Australia will also see rapid increases in coniferous sawnwood exports, but both a smaller base (Tables 94).
Historically, the Asia-Pacific region has been a net importer of coniferous sawnwood, and will continue to be so in the future. By 2010, the major suppliers of the region would be Canada (60 million m3) and the United States (7.5 million) (Table 95). The only noticeable exporter of coniferous sawnwood in the region is New Zealand, as its exports would amount to nearly 1.3 million m3 in 2010. About 90% of which would be shipped to other Asia-Pacific countries.
Table 93. Imports of coniferous sawnwood, in thousand m3, 1992-2010.
|
Country |
1992 |
2000 |
2010 |
|
Australia |
1030 |
761 |
456 |
|
China |
367 |
783 |
1276 |
|
Hong Kong |
23 |
2 |
2 |
|
India |
2 |
3 |
9 |
|
Indonesia |
0 |
1 |
1 |
|
Japan |
8433 |
6529 |
6929 |
|
Korea Rep |
121 |
214 |
313 |
|
Malaysia |
16 |
8 |
12 |
|
Myanmar |
|
0 |
0 |
|
New Zealand |
20 |
13 |
11 |
|
Papua New Guinea |
0 |
|
|
|
Philippines |
1 |
3 |
4 |
|
Singapore |
11 |
13 |
15 |
|
Solomon Islands |
0 |
|
|
|
Thailand |
|
|
|
|
Rest of the Asia-Pacific |
91 |
931 |
1212 |
|
Asia Pacific |
10115 |
9259 |
10239 |
|
Canada |
1322 |
1586 |
2578 |
|
Chile |
0 |
|
|
|
European Union |
8817 |
5400 |
3234 |
|
Russia |
19 |
1 |
1 |
|
United States |
31578 |
40366 |
51574 |
|
Rest of the World |
8349 |
8870 |
13473 |
|
World |
60200 |
65481 |
81098 |
|
Share |
17% |
14% |
13% |
Table 94. Exports of coniferous sawnwood, in thousand m3, 1992-2010.
|
Country |
1992 |
2000 |
2010 |
|
Australia |
10 |
197 |
321 |
|
China |
39 |
28 |
17 |
|
Hong Kong |
26 |
|
|
|
India |
0 |
|
|
|
Indonesia |
27 |
|
|
|
Japan |
3 |
|
|
|
Korea Rep |
85 |
|
|
|
Malaysia |
96 |
84 |
68 |
|
Myanmar |
|
|
|
|
New Zealand |
912 |
1150 |
1347 |
|
Papua New Guinea |
0 |
|
|
|
Philippines |
|
|
|
|
Singapore |
11 |
|
|
|
Solomon Islands |
|
|
|
|
Thailand |
|
|
|
|
Rest of the Asia-Pacific |
255 |
1596 |
2619 |
|
Asia Pacific |
1464 |
3055 |
4371 |
|
Canada |
45670 |
48242 |
60075 |
|
Chile |
825 |
648 |
452 |
|
European Union |
2192 |
3254 |
5290 |
|
Russia |
3060 |
2094 |
1536 |
|
United States |
6256 |
6513 |
8247 |
|
Rest of the World |
5485 |
1675 |
1128 |
|
World |
64952 |
65481 |
81098 |
|
Share |
2% |
5% |
5% |
Table 95. Direction of trade in coniferous sawnwood, in thousand m3, 2010.
Japan should remain the dominant importer among all other countries in the region. Ranked by volume, the main suppliers of softwood lumber to the Japanese market in 2010 should be Canada (4.0 million m3), the United States (2.0 million), New Zealand (600 thousand), and Russia (200 thousand). The evolution of Japanese softwood lumber imports by major suppliers from 1962 to 2010 are displayed in Figure 25.
Figure 25. Japanese softwood lumber imports from major suppliers, 1962-2010.
By 2010, Canada will supply a 58% of Japan's softwood lumber imports, up from 57% in 1992, while the United States share is expected to rise from 27% in 1992 to 29% in 2010. Such growths could be materialized only if business continued as usual in North America. However, a recent CINTRAFOR (1995) study suggested that continued expansion of lumber exports from North America may be limited by resource constraints and environmental issues in British Columbia and the U.S. Pacific Northwest. Although small, New Zealand is also expected to increase exports of coniferous sawnwood to Japan (Figure 25). But for Chile and Russia, the forecasts imply that the exports would decline gradually. These results agree with the CINTRAFOR study (1995) which suggests that New Zealand and Chile's principal species of softwood lumber, radiata pine, has been mostly used in Japan for lower-valued end uses, such as packaging, and can not be used to substitute Japanese domestic species or Douglas-fir and western hemlock form North America in the traditional housing market. For Russia, despite its high supply potential, the likelihood of radical expansion in softwood lumber exports to Japan may be reduced by the limited capital investment in production capacity and the inability of Russian woods to substitute for high-quality species used in traditional housing.
Total consumption of non-coniferous sawnwood in the Asia-Pacific region are projected to increase from 50 million m3 in 1992 to 58 million in 2000 and 66 million in 2010 (Table 96). This implies an average annual growth of 1.7% between 1992 and 2010, compared to 2.8% from 1972 to 1992. The region's global share is expected to rise from 39% in 1992 to 41 % in the year 2000 and 43 % in 2010.
Table 96. Consumption of non-coniferous sawnwood, in thousand m3, 1992-2010.
|
Country |
1992 |
2000 |
2010 |
|
Australia |
1610 |
1819 |
1967 |
|
China |
9061 |
10017 |
12007 |
|
Hong Kong |
407 |
435 |
497 |
|
India |
14956 |
17200 |
19231 |
|
Indonesia |
7589 |
9128 |
10657 |
|
Japan |
4638 |
4960 |
5366 |
|
Korea Rep |
1492 |
2078 |
2472 |
|
Malaysia |
3911 |
4744 |
5667 |
|
Myanmar |
-27 |
|
|
|
New Zealand |
66 |
74 |
80 |
|
Papua New Guinea |
70 |
69 |
74 |
|
Philippines |
392 |
393 |
449 |
|
Singapore |
218 |
244 |
290 |
|
Solomon Islands |
8 |
2 |
2 |
|
Thailand |
2855 |
3240 |
3846 |
|
Rest of the Asia-Pacific |
2785 |
3166 |
3735 |
|
Asia Pacific |
50031 |
57567 |
66339 |
|
Canada |
1097 |
1208 |
1304 |
|
Chile |
420 |
504 |
582 |
|
European Union |
13612 |
14895 |
15873 |
|
Russia |
12944 |
11782 |
12510 |
|
United States |
24802 |
26283 |
28181 |
|
Rest of the World |
25904 |
27578 |
31056 |
|
World |
128810 |
139815 |
155846 |
|
Share |
39% |
41% |
43% |
Consumption will grow between 1992 and 2010 in almost all of the countries or territories in the region. By the year 2010, the leading consumers of hardwood lumber in the region will be India with 19 million m3, China with 12 million and Indonesia with 11 million.
Figure 26 shows consumption and production of hardwood lumber in Japan from 1962 to 2010. Consumption will drop from the peak of 12 million m3 in 1973 to 5 million in the year 2010, reflecting the falling supply of tropical hardwoods. Production, however, will increase to 4.6 million m3 in 2010.
Figure 26. Non-coniferous sawnwood production and consumption in Japan, 1962-2010.
The production of the region is expected to grow from 50 million m3 in 1992 to 59 million in 2000 and 67 million by the year 2010 (Table 97). The region's world share is also to rise from 39% in 1992 to 42% and 43% in 2000 and 2010. Ranked by 2010 production levels, the major producers of non-coniferous sawnwood will be India with 19 million m3, Indonesia and Malaysia with 12 and 11 million respectively, and China with nearly 10 million. Of them, India will be self-sufficient in supplying its hardwood lumber market, China will be an importing country, and Indonesia and Malaysia will be main exporters of hardwood sawnwood.
The Asia-Pacific region has been a net exporter of non-coniferous sawnwood. This trend is likely to continue over the next two decades. Tables 98 and 99 summarize the import and export trends for non-coniferous sawnwood world-wide from 1992 to 2010. The Asia-Pacific region's imports are projected to increase 21% from 7 million m3 in 1992 to 8.6 million in the year 2010, while exports will increase 12% over the same period. The region's share of world imports will rise from 43% in 1992 and 58% in 2010, and the share of world exports is forecast to increase from 53% in 1992 to 61% in 2010.
Table 97. Production of non-coniferous sawnwood, in thousand m3, 1992-2010.
|
Country |
1992 |
2000 |
2010 |
|
Australia |
1464 |
1874 |
2276 |
|
China |
7865 |
8684 |
9746 |
|
Hong Kong India |
14960 |
17196 |
19218 |
|
Indonesia |
8300 |
10427 |
12445 |
|
Japan |
3106 |
3985 |
4573 |
|
Korea Rep |
703 |
1436 |
2013 |
|
Malaysia |
9300 |
10048 |
10612 |
|
Myanmar |
282 |
372 |
541 |
|
New Zealand |
57 |
66 |
75 |
|
Papua New Guinea |
74 |
72 |
78 |
|
Philippines |
448 |
428 |
462 |
|
Singapore |
20 |
322 |
536 |
|
Solomon Islands |
16 |
0 |
0 |
|
Thailand |
1077 |
657 |
410 |
|
Rest of the Asia-Pacific |
2805 |
3116 |
3716 |
|
Asia Pacific |
50477 |
58682 |
66700 |
|
Canada |
806 |
1580 |
2300 |
|
Chile |
437 |
524 |
599 |
|
European Union |
9177 |
12164 |
14494 |
|
Russia |
13000 |
11837 |
12576 |
|
United States |
26456 |
27351 |
28768 |
|
Rest of the World |
28562 |
27676 |
30410 |
|
World |
128915 |
139815 |
155846 |
|
Share |
39% |
42% |
43% |
The leading importers are projected to be Thailand (3.5 million m3), China (2.3 million), Japan (0.79 million), Singapore (0.74 million), and the Republic of Korea (0.46 million). Of those five countries, Japan, Republic of Korea and Singapore would have a declining trend in imports of hardwood lumber from 1992 to 2010.
The largest exporter will be Malaysia (4.9 million m3), supplying more than half of the regional total exports, followed by Indonesia (1.8 million) and Singapore (1.0 million). While the exports from Malaysia would decrease slightly, Indonesia's exports of non-coniferous sawnwood would more than double between 1992 and 2010.
Table 100 shows the projected direction of trade in non-coniferous sawnwood in the year 2010. Relative to the 1992's levels (Table 28), exports from Indonesia and Singapore are expected to expand, while those from Malaysia and China would decline. For Malaysia, over 90% of total exports will go to countries within the Asia-Pacific countries, and the leading importers in the year 2010 will be Thailand with 3.5 million m3, and China with 2.3 million. Outside the region, the European Union will continue to be the largest importer of Asia-Pacific hardwood lumber, and the volumes are expected to increase from about 1.5 million m3 to 1.8 million between 1992 and 2010.
Table 98. Imports of non-coniferous sawnwood, in thousand m3, 1992-2010.
|
Country |
1992 |
2000 |
2010 |
|
Australia |
163 |
213 |
128 |
|
China |
1423 |
1447 |
2331 |
|
Hong Kong |
248 |
435 |
497 |
|
India |
3 |
4 |
13 |
|
Indonesia |
0 |
1 |
1 |
|
Japan |
1551 |
975 |
793 |
|
Korea Rep |
792 |
642 |
459 |
|
Malaysia |
28 |
0 |
0 |
|
Myanmar |
|
0 |
0 |
|
New Zealand |
12 |
8 |
6 |
|
Papua New Guinea |
0 |
|
|
|
Philippines |
|
3 |
10 |
|
Singapore |
923 |
891 |
742 |
|
Solomon Islands |
0 |
8 |
6 |
|
Thailand |
1822 |
2616 |
3456 |
|
Rest of the Asia-Pacific |
150 |
157 |
144 |
|
Asia Pacific |
7115 |
7398 |
8584 |
|
Canada |
832 |
514 |
308 |
|
Chile |
0 |
|
|
|
European Union |
6374 |
2988 |
1799 |
|
Russia |
1 |
1 |
1 |
|
United States |
652 |
914 |
1267 |
|
Rest of the World |
1635 |
2182 |
2761 |
|
World |
16609 |
13999 |
14720 |
|
Share |
43% |
53% |
58% |
Table 99. Exports of non-coniferous sawnwood, in thousand m3, 1992-2010.
|
Country |
1992 |
2000 |
2010 |
|
Australia |
17 |
269 |
437 |
|
China |
227 |
115 |
70 |
|
Hong Kong |
262 |
|
|
|
India |
7 |
|
|
|
Indonesia |
711 |
1299 |
1788 |
|
Japan |
19 |
|
|
|
Korea Rep |
3 |
|
|
|
Malaysia |
5417 |
5305 |
4945 |
|
Myanmar |
309 |
372 |
541 |
|
New Zealand |
3 |
|
|
|
Papua New Guinea |
4 |
3 |
4 |
|
Philippines |
56 |
38 |
23 |
|
Singapore |
725 |
969 |
987 |
|
Solomon Islands |
8 |
6 |
4 |
|
Thailand |
44 |
33 |
20 |
|
Rest of the Asia-Pacific |
176 |
106 |
125 |
|
Asia Pacific |
7988 |
8513 |
8944 |
|
Canada |
541 |
887 |
1304 |
|
Chile |
17 |
21 |
17 |
|
European Union |
174 |
258 |
419 |
|
Russia |
57 |
56 |
68 |
|
United States |
2306 |
1983 |
1854 |
|
Rest of the World |
3866 |
2281 |
2114 |
|
World |
14949 |
13999 |
14720 |
|
Share |
53% |
61% |
61% |
Table 100. Direction of trade in non-coniferous sawnwood, in thousand m3, 2010.
Exports of North American hardwood lumber to the Asia-Pacific countries are projected to increase more than 4 times, from 700 thousand m3 in 1992 to 3.1 million in 2010. The main destinations of the exports will be Japan (180 thousand m3) and China (646 thousand).
Wood-based panels have seen the fastest growth, among all forest products, in consumption, production and trade since 1962 in the Asia-Pacific region. This trend will change over the next two decades, as shown in Figure 27. The Asia-Pacific region's wood-based panels consumption is expected to increase nearly 40% between 1992 and 2010, from 29 million m3 to about 40 million. This is an average growth of 2% per year. Over the same period, the world total consumption of wood-based panels is projected to increase from 121 million m3 in 1992 to 146 million in the year 2010. Thus, the Asia-Pacific region's share of the world would rise from 24% in 1992 to 27% by the year 2010.
The 1992 distribution of the region's consumption was: veneer sheets - 7%, plywood - 65%, particle board - 15%, and fibreboard - 13%. By the year 2010, this distribution would change slightly: veneer sheets - 7%, plywood - 66%, particle board -14%, and fibreboard - 13% (Figure 27).
The world prices for wood-based panels, in 1992 US dollar, are shown in Figure 28. Historically, prices for veneer sheets and plywood have been parallel and have declined in real terms, while prices of particle board and fibreboard remained fairly constant. This trend is predicted to change over the next two decades, with all panel products prices rising and prices of veneer sheets and plywood growing faster as prices of industrial roundwood increase. Prices of veneer sheets and plywood are projected to increase from $583 to $697 and from $385 to $548, respectively, between 1992 and the year 2010. Prices will also go up from $232 to $304 for particle board and from $301 to $431 for fibreboard.
Although Japan's consumption of wood-based panels is expected to increase from 12.4 million m3 in 1992 to 14.5 million in the year 2010. China has the potential to replace it as the largest consumer in the region. Consumption of wood-based panels in China is projected to increase 50% from 1992 to 2010, from slightly under 8 million m3 to more than 12 million. Other countries which will have tremendous increases in consumption include Indonesia, the Republic of Korea, Malaysia, Australia, and Thailand.
Figure 27. Wood-based panels consumption in the Asia-Pacific and the world, 1962-2010.
Figure 28. Real world prices of wood-base panels, 1962-2010.
Table 101 shows the forecasts of world-wide veneer sheets consumption to 2010. Consumption of veneer sheets in the Asia-Pacific region is expected to increase from 2 million m3 in 1992 to 2.4 million in the year 2000 and 2.9 million in 2010. This represents an annual increase of 1.9% between 1992 and 2000 and 1.6% for the 2000-2010 period, down from the 6% growth for the 1982-92 period and much lower than the 87% growth during the period of 1962-92. The Asia-Pacific region's share of the world's total will rise from 36% in 1992 to 38% in the year 2000 and 39% in 2010, reflecting faster growth in consumption than the world average in the next two decades.
Table 101. Consumption of veneer sheets, in thousand m3, 1992-2010.
|
Country |
1992 |
2000 |
2010 |
|
Australia |
41 |
45 |
50 |
|
China |
128 |
250 |
314 |
|
Hong Kong |
5 |
6 |
6 |
|
India |
2 |
2 |
2 |
|
Indonesia |
37 |
47 |
58 |
|
Japan |
989 |
1076 |
1187 |
|
Korea Rep |
0 |
|
|
|
Malaysia |
438 |
570 |
712 |
|
Myanmar |
0 |
|
|
|
New Zealand |
34 |
37 |
42 |
|
Papua New Guinea |
33 |
35 |
38 |
|
Philippines |
18 |
20 |
24 |
|
Singapore |
77 |
104 |
129 |
|
Solomon Islands |
0 |
|
|
|
Thailand |
172 |
225 |
278 |
|
Rest of the Asia-Pacific |
9 |
11 |
11 |
|
Asia Pacific |
1983 |
2428 |
2850 |
|
Canada |
310 |
335 |
368 |
|
Chile |
16 |
20 |
24 |
|
European Union |
1705 |
1909 |
2097 |
|
Russia |
402 |
380 |
410 |
|
United States |
102 |
106 |
115 |
|
Rest of the World |
992 |
1214 |
1471 |
|
World |
5510 |
6392 |
7336 |
|
Share |
36% |
38% |
39% |
Most countries within the region are expected to increase their domestic consumption of veneer sheets over the next twenty years. Among them, Japan, Malaysia and China will remain the top three consumers of veneer sheets. China's consumption is projected to increase from 128 thousand m3 in 1992 to about 314 thousand in the year 2010. Consumption of veneer sheets in Japan is likely to increase between 1992 and the year 2010, from 989 thousand m3 to 1.2 million. Similar to China and Japan, Malaysia will also experience a faster growth period, and nearly double its veneer sheets consumption by the year 2010. Besides these three countries, Thailand and Singapore will also be important consumers of veneer sheets in the Asia-Pacific region by the year 2010.
To meet the increasing requirements, the production of veneer sheets in the Asia-Pacific region is projected to rise accordingly, from 1.9 million m3 in 1992 to 2.1 million in 2000 and 2.2 million in 2010. The region's world share will decrease from 35% in 1992 to 34% in the year 2000 and 30% in 2010 (Table 102).
Table 102. Production of veneer sheets, in thousand m3, 1992-2010.
|
Country |
1992 |
2000 |
2010 |
|
Australia |
29 |
38 |
45 |
|
China |
7 |
0 |
0 |
|
Hong Kong |
|
|
|
|
India |
4 |
0 |
0 |
|
Indonesia |
55 |
96 |
125 |
|
Japan |
289 |
531 |
599 |
|
Korea Rep |
0 |
|
|
|
Malaysia |
1200 |
1227 |
1211 |
|
Myanmar |
0 |
|
|
|
New Zealand |
35 |
37 |
42 |
|
Papua New Guinea |
33 |
35 |
38 |
|
Philippines |
36 |
31 |
22 |
|
Singapore |
65 |
101 |
126 |
|
Solomon Islands |
0 |
|
|
|
Thailand |
167 |
89 |
0 |
|
Rest of the Asia-Pacific |
11 |
0 |
0 |
|
Asia Pacific |
1931 |
2185 |
2208 |
|
Canada |
501 |
654 |
794 |
|
Chile |
20 |
24 |
27 |
|
European Union |
1313 |
1668 |
1997 |
|
Russia |
400 |
379 |
409 |
|
United States |
|
0 |
0 |
|
Rest of the World |
1316 |
1498 |
1912 |
|
World |
5481 |
6408 |
7346 |
|
Share |
35% |
34% |
30% |
Among all countries, Malaysia would remain the largest producer of veneer sheets in the region by the year 2010. Japan is expected to be the second largest producer of veneer sheets, and production is forecast to increase from 289 thousand m3 to 600 thousand in 2010. Over the same period, China will most likely not produce veneer sheets.
Total imports of veneer sheets by countries in the Asia-Pacific region are expected to rise from 954 thousand m3 in 1992 to 1.0 million in the year 2000 and 1.3 million in 2010 (Table 103). But the expansion of imports would be slower with an average annual growth rate of 1% between 1992 and 2000 and 3% between 2000 and 2010, against 15% from 1982 to 1992. The region's world share will decrease from 42% in 1992 to 39% in 2010. The leading importer will still be Japan with 0.6 million m3, followed by China with 314 thousand and Thailand with 282 thousand.
Table 103. Imports of veneer sheets, in thousand m3, 1992-2010.
|
Country |
1992 |
2000 |
2010 |
|
Australia |
13 |
8 |
5 |
|
China |
125 |
251 |
314 |
|
Hong Kong |
21 |
7 |
7 |
|
India |
|
2 |
2 |
|
Indonesia |
0 |
7 |
7 |
|
Japan |
738 |
544 |
588 |
|
Korea Rep |
|
15 |
10 |
|
Malaysia |
3 |
3 |
12 |
|
Myanmar |
|
0 |
0 |
|
New Zealand |
1 |
|
|
|
Papua New Guinea |
|
|
|
|
Philippines |
|
3 |
10 |
|
Singapore |
34 |
23 |
19 |
|
Solomon Islands |
9 |
|
|
|
Thailand |
9 |
138 |
282 |
|
Rest of the Asia-Pacific |
1 |
19 |
20 |
|
Asia Pacific |
954 |
1020 |
1277 |
|
Canada |
35 |
108 |
97 |
|
Chile |
|
|
|
|
European Union |
392 |
311 |
207 |
|
Russia |
3 |
2 |
1 |
|
United Stales |
720 |
704 |
697 |
|
Rest of the World |
145 |
1086 |
1028 |
|
World |
2249 |
3229 |
3307 |
|
Share |
42% |
32% |
39% |
Table 104. Exports of veneer sheets, in thousand m3, 1992-2010.
|
Country |
1992 |
2000 |
2010 |
|
Australia |
1 |
|
|
|
China |
4 |
1 |
1 |
|
Hong Kong |
16 |
|
|
|
India |
2 |
|
|
|
Indonesia |
18 |
56 |
75 |
|
Japan |
38 |
|
|
|
Korea Rep |
0 |
|
|
|
Malaysia |
765 |
660 |
511 |
|
Myanmar |
0 |
|
|
|
New Zealand |
2 |
|
|
|
Papua New Guinea |
0 |
|
|
|
Philippines |
18 |
13 |
8 |
|
Singapore |
22 |
20 |
16 |
|
Solomon Islands |
4 |
|
|
|
Thailand |
4 |
3 |
4 |
|
Rest of the Asia-Pacific |
3 |
9 |
9 |
|
Asia Pacific |
897 |
762 |
624 |
|
Canada |
226 |
427 |
522 |
|
Chile |
4 |
4 |
3 |
|
European Union |
52 |
69 |
108 |
|
Russia |
1 |
|
|
|
United States |
618 |
599 |
582 |
|
Rest of the World |
339 |
1369 |
1469 |
|
World |
2137 |
3229 |
3307 |
|
Share |
42% |
24% |
19% |
As shown in Table 104, exports of veneer sheets by countries in the Asia-pacific region are projected to increase from 2.1 million m3 in 1992 to 3.3 million in 2010. The region's share of the world total exports would drop from 42% in 1992 to 19% by 2010. The main exporters in the region are Malaysia (511 thousand m3) and Indonesia (75 thousand).
The direction of trade in veneer sheets in the year 2010 are reported in Table 105. Japan and China would be the main importers, supplied mainly by Malaysia, Indonesia, and the rest of the world.
Table 105. Direction of trade in veneer, in thousand m3, 2010.
Table 106 reports world-wide consumption of plywood from 1992 to 2010. Plywood consumption in the Asia-pacific region is expected to amount to 23 million m3 by the year 2000 and 27 million by the year 2010, up 19% and 40% respectively from 1992's level. The region's share of the world's total will rise from 40% in 1992 to 42% in the year 2000 and 43 % in 2010.
While consumption is projected to grow in all countries within the region, Japan, China, the Republic of Korea and Indonesia are expected to hold their leading positions of plywood consumption by 2010. The combined consumption of these four countries would account for nearly 90% of the total plywood consumption in the region, the same as in 1992.
China's consumption is projected to almost double between 1992 and 2010, from 4.6 million m3 to about 7.7 million. Consumption of plywood in Japan is likely to rise 20% over the same period, from 9.2 million m3 to 11 million. Indonesia, as the largest plywood producer in the region, may see its consumption increase from 1.5 million in 1992 to 2.3 in 2010. Similar to China, Japan and Indonesia, the Republic of Korea will also experience a faster growth in its plywood consumption by the year 2010.
Table 106. Consumption of plywood, in thousand m3, 1992-2010
|
Country |
1992 |
2000 |
2010 |
|
Australia |
169 |
186 |
206 |
|
China |
4642 |
6142 |
7701 |
|
Hong Kong |
205 |
237 |
279 |
|
India |
354 |
423 |
506 |
|
Indonesia |
1465 |
1846 |
2278 |
|
Japan |
9191 |
9994 |
11025 |
|
Korea Rep |
1840 |
2358 |
2930 |
|
Malaysia |
438 |
570 |
712 |
|
Myanmar |
15 |
18 |
22 |
|
New Zealand |
50 |
55 |
62 |
|
Papua New Guinea |
13 |
14 |
15 |
|
Philippines |
162 |
186 |
219 |
|
Singapore |
166 |
214 |
266 |
|
Solomon Islands |
0 |
|
|
|
Thailand |
208 |
260 |
322 |
|
Rest of the Asia-Pacific |
117 |
127 |
146 |
|
Asia Pacific |
19035 |
22628 |
26688 |
|
Canada |
1667 |
1798 |
1979 |
|
Chile |
36 |
45 |
54 |
|
European Union |
5352 |
5906 |
6487 |
|
Russia |
968 |
917 |
989 |
|
United States |
17124 |
18407 |
20073 |
|
Rest of the World |
3668 |
4224 |
5113 |
|
World |
47850 |
53925 |
61383 |
|
Share |
40% |
42% |
43% |
Table 107 shows the production of plywood by country and territory for the period 1992-2010. Coupled with the increases in consumption, production of plywood in the Asia-Pacific region is projected to rise from 23 million m3 in 1992 to 27 million in the year 2000 and 30 million in 2010. The region's production will represent 50% of the world's total in the year 2000 and 48% in 2010, up slightly from 47% in 1992.
Among all countries, Indonesia and Japan will continue to be the top producers in the region, followed by China which is expected to replace Malaysia as the third largest producer of plywood in the region by the year 2010. Indonesia's production is forecast to grow from 10 million m3 in 1992 to 12 million by 2010. Japan is expected to improve its self-sufficiency in plywood, and production is forecast to increase from 6 million m3 to 9 million for the period 1992-2010, and to account for 81% of domestic consumption, up from 65% in 1992. Over the same time, China's plywood production would increase from 2 million m3 to 2.5 million by the year 2010.
The Asia-Pacific region has been a net exporter of plywood during the last thirty years. This trend is likely to continue over the next two decades. The region's imports are projected to increase 13% from 8.4 million m3 in 1992 to 9.5 million in the year 2010, while exports will rise only 6% over the same period, due mainly to the accelerating consumption within the region, meanwhile the region's share of world plywood imports is expected to rise from 56% in 1992 and 57% in 2010, and the share of world exports to decline from 79% to 76% between 1992 and 2010 (Tables 108 and 109).
Table 107. Production of plywood, in thousand m3, 1992-2010.
|
Country |
1992 |
2000 |
2010 |
|
Australia |
107 |
139 |
176 |
|
China |
2078 |
2250 |
2500 |
|
Hong Kong |
12 |
92 |
214 |
|
India |
360 |
420 |
493 |
|
Indonesia |
10100 |
11387 |
12227 |
|
Japan |
5954 |
7653 |
8981 |
|
Korea Rep |
948 |
1511 |
2044 |
|
Malaysia |
2100 |
2189 |
2080 |
|
Myanmar |
15 |
17 |
16 |
|
New Zealand |
77 |
95 |
101 |
|
Papua New Guinea |
13 |
14 |
15 |
|
Philippines |
247 |
242 |
245 |
|
Singapore |
280 |
426 |
418 |
|
Solomon Islands |
|
|
|
|
Thailand |
170 |
207 |
233 |
|
Rest of the Asia-Pacific |
68 |
126 |
26 |
|
Asia Pacific |
22529 |
26767 |
29769 |
|
Canada |
1838 |
2055 |
2386 |
|
Chile |
57 |
66 |
66 |
|
European Union |
2331 |
3552 |
5414 |
|
Russia |
1221 |
1099 |
1146 |
|
United States |
17109 |
17756 |
18349 |
|
Rest of the World |
2865 |
2633 |
4251 |
|
World |
47950 |
53927 |
61381 |
|
Share |
47% |
50% |
48% |
Table 108. Imports of plywood, in thousand m3, 1992-2010.
|
Country |
1992 |
2000 |
2010 |
|
Australia |
65 |
48 |
29 |
|
China |
2768 |
3975 |
5251 |
|
Hong Kong |
637 |
643 |
484 |
|
India |
7 |
3 |
13 |
|
Indonesia |
0 |
1 |
2 |
|
Japan |
3278 |
2341 |
2044 |
|
Korea Rep |
953 |
847 |
886 |
|
Malaysia |
8 |
8 |
30 |
|
Myanmar |
|
2 |
6 |
|
New Zealand |
2 |
|
|
|
Papua New Guinea |
0 |
|
|
|
Philippines |
|
3 |
10 |
|
Singapore |
547 |
539 |
458 |
|
Solomon Islands |
0 |
|
|
|
Thailand |
41 |
55 |
90 |
|
Rest of the Asia-Pacific |
60 |
207 |
200 |
|
Asia Pacific |
8366 |
8671 |
9502 |
|
Canada |
224 |
207 |
154 |
|
Chile |
|
|
|
|
European Union |
3019 |
2693 |
1624 |
|
Russia |
3 |
2 |
1 |
|
United States |
1572 |
1899 |
2516 |
|
Rest of the World |
1797 |
3556 |
2862 |
|
World |
14981 |
17027 |
16657 |
|
Share |
56% |
51% |
57% |
Table 109. Exports of plywood, in thousand m3, 1992-2010.
|
Country |
1992 |
2000 |
2010 |
|
Australia |
3 |
|
|
|
China |
204 |
83 |
50 |
|
Hong Kong |
444 |
498 |
418 |
|
India |
13 |
|
|
|
Indonesia |
8635 |
9542 |
9951 |
|
Japan |
41 |
|
|
|
Korea Rep |
61 |
|
|
|
Malaysia |
1670 |
1627 |
1398 |
|
Myanmar |
0 |
|
|
|
New Zealand |
29 |
40 |
39 |
|
Papua New Guinea |
0 |
|
|
|
Philippines |
85 |
59 |
35 |
|
Singapore |
661 |
752 |
610 |
|
Solomon Islands |
|
|
|
|
Thailand |
3 |
2 |
1 |
|
Rest of the Asia-Pacific |
11 |
206 |
80 |
|
Asia Pacific |
11860 |
12807 |
12584 |
|
Canada |
395 |
463 |
560 |
|
Chile |
21 |
21 |
13 |
|
European Union |
230 |
339 |
551 |
|
Russia |
256 |
184 |
157 |
|
United States |
1557 |
1248 |
792 |
|
Rest of the World |
764 |
1966 |
2000 |
|
World |
15083 |
17027 |
16657 |
|
Share |
79% |
75% |
76% |
The projected leading importers include China with 5.3 million m3, Japan with 2.0 million the Republic of Korea with 0.9 million. Of those three countries, Japan and Republic of Korea would experience a declining trend in imports of plywood, mostly hardwood, from 1992 to 2010. Japanese imports would decline by 38%, while those of China are expected to almost double.
Indonesia would continue to be the main exporter with nearly ten million m3 of plywood exports in the year 2010, which represents about 79% of the region total exports, followed by Malaysia with 1.4 million. The projected increase in exports is 15% for Indonesia and the projected decrease in exports is 16% for Malaysia between 1992 and 2010. The exports from these two countries are expected to account for 90% of the total exports of the Asia-Pacific region.
Table 110 shows the projected direction of trade in plywood in the year 2010. Compared to the 1992 levels (Table 44), Japanese imports of plywood from Indonesia are expected to decrease, while imports of China from Indonesia would increase much. Outside the Asia-Pacific region, the United States and the European Union will continue to be the largest importers of Asia-Pacific plywood, and the volumes are expected to increase from 1.2 million m3 to 1.9 million for the United States, and decrease from 1.1 million m3 to 587 thousand for the European Union, between 1992 and 2010.
Exports of North American plywood to the Asia-Pacific region are projected to increase from 96 thousand m3 in 1992 to 155 thousand in the year 2010. The main destination will be Japan (99 thousand m3).
Table 110. Direction of trade in plywood, in thousand m3, 2010.
Consumption of particle board in the Asia-Pacific region is expected to increase from 4.5 million m3 in 1992 to 5.0 million in the year 2000 and 5.4 million in 2010 (Table 111). This represents an annual increase of 2% between 1992 and 2000 and 1% for the 2000-2010 period, down sharply from the 13% growth for the 1982-92, The Asia-Pacific region's share of the world's total will rise from 9% in 1992 to 10% in 2010.
China, Japan and the Republic of Korea will be the top three consumers. China's consumption is projected to increase from 1.4 million m3 in 1992 to about 1.6 million in the year 2010. Consumption in Japan is likely to decrease slightly between 1992 and 2010, from 1.2 million m3 to 1.1 million. Australia and the Republic of Korea will experience a faster growth in their particle board consumption by the year 2010.
Production of particle board in most countries is expected to grow in concert with consumption (Table 112). The production of particle board in the Asia-Pacific region is projected to grow from 4.0 million m3 in 1992 to 4.8 million in the year 2000 and 5.0 million by the year 2010. The region's world share is also to rise from 8% in 1992 to 10% and 9% in 2000 and 2010. Ranked by 2010 production levels, the major producers of particle board will be China with 1.4 million m3, Japan with 1.0 million and Australia with 0.9 million. Of them, Japan and Australia are expected to be mostly self-sufficient with production-consumption ratios of 94% and 98%, respectively.
Table 111. Consumption of particle board, in thousand m3, 1992-2010.
|
Country |
1992 |
2000 |
2010 |
|
Australia |
658 |
730 |
884 |
|
China |
1357 |
1327 |
1596 |
|
Hong Kong |
2 |
2 |
2 |
|
India |
32 |
21 |
17 |
|
Indonesia |
234 |
262 |
346 |
|
Japan |
1174 |
1267 |
1090 |
|
Korea Rep |
727 |
968 |
1007 |
|
Malaysia |
100 |
118 |
130 |
|
Myanmar |
|
|
|
|
New Zealand |
91 |
97 |
85 |
|
Papua New Guinea |
0 |
|
|
|
Philippines |
3 |
3 |
3 |
|
Singapore |
0 |
|
|
|
Solomon Islands |
|
|
|
|
Thailand |
69 |
82 |
87 |
|
Rest of the Asia-Pacific |
69 |
128 |
162 |
|
Asia Pacific |
4516 |
5003 |
5409 |
|
Canada |
1367 |
1455 |
1394 |
|
Chile |
137 |
144 |
149 |
|
European Union |
22432 |
24396 |
27928 |
|
Russia |
4427 |
3454 |
3895 |
|
United States |
8732 |
7985 |
8830 |
|
Rest of the World |
6460 |
6292 |
7480 |
|
World |
48071 |
48730 |
55085 |
|
Share |
9% |
10% |
10% |
Table 112. Production of particle board, in thousand m3, 1992-2010.
|
Country |
1992 |
2000 |
2010 |
|
Australia |
660 |
692 |
862 |
|
China |
1202 |
1176 |
1357 |
|
Hong Kong |
|
|
|
|
India |
32 |
18 |
4 |
|
Indonesia |
350 |
483 |
558 |
|
Japan |
1050 |
1208 |
1022 |
|
Korea Rep |
276 |
632 |
638 |
|
Malaysia |
150 |
167 |
156 |
|
Myanmar |
|
|
|
|
New Zealand |
162 |
201 |
183 |
|
Papua New Guinea |
|
|
|
|
Philippines |
6 |
3 |
0 |
|
Singapore |
|
|
|
|
Solomon Islands |
|
|
|
|
Thailand |
65 |
82 |
87 |
|
Rest or the Asia-Pacific |
69 |
101 |
138 |
|
Asia Pacific |
4022 |
4763 |
5004 |
|
Canada |
3256 |
3876 |
4650 |
|
Chile |
240 |
240 |
206 |
|
European Union |
21725 |
24295 |
28467 |
|
Russia |
4460 |
3480 |
3924 |
|
United States |
7207 |
5924 |
5816 |
|
Rest of the World |
7164 |
6189 |
7042 |
|
World |
48074 |
48766 |
55107 |
|
Share |
8% |
10% |
9% |
The Asia-Pacific region has been a net importer of particle board since the 1980s. This trend is not expected to change over the next two decades. The total imports by countries in the Asia-Pacific region are projected to remain 800 thousand m3 level between 1992 and 2010 (Table 113), compared to 118% from 1982 to 1992. This is mainly due to increases in domestic production in the region. The world share of the Asia-Pacific will decrease from 15% in 1992 to 13% in 2010. The leading importers will include the Republic of Korea with 370 and China with 241 thousand.
Table 113. Imports of particle board, in thousand m3, 1992-2010.
|
Country |
1992 |
2000 |
2010 |
|
Australia |
28 |
37 |
22 |
|
China |
158 |
154 |
241 |
|
Hong Kong |
40 |
36 |
36 |
|
India |
0 |
3 |
13 |
|
Indonesia |
|
1 |
2 |
|
Japan |
125 |
59 |
67 |
|
Korea Rep |
451 |
336 |
370 |
|
Malaysia |
|
1 |
4 |
|
Myanmar |
|
0 |
0 |
|
New Zealand |
0 |
|
|
|
Papua New Guinea |
0 |
|
|
|
Philippines |
|
2 |
5 |
|
Singapore |
54 |
35 |
22 |
|
Solomon Islands |
|
|
|
|
Thailand |
4 |
|
|
|
Rest of the Asia-Pacific |
8 |
28 |
25 |
|
Asia Pacific |
868 |
691 |
807 |
|
Canada |
173 |
115 |
85 |
|
Chile |
|
|
|
|
European Union |
6284 |
696 |
420 |
|
Russia |
3 |
2 |
1 |
|
United States |
1843 |
2466 |
3375 |
|
Rest of the World |
625 |
1224 |
1487 |
|
World |
5649 |
5193 |
6175 |
|
Share |
15% |
13% |
13% |
As shown in Table 114, the exports of particle board by countries in the Asia-Pacific region are projected to remain stable from 1992 to 2010. The region's share of the world total exports would hold stable around 6-8% for the same period. The main exporters in the region are Indonesia (214 thousand m3) and New Zealand (98 thousand).
The directions of trade forecasts for particle board in the year 2010 (Table 115) show the Republic of Korea as main importer of particle board both from the Asia-Pacific region and from other parts of the world, as in 1992 (Table 43). The United States is projected to remain the leading supplier of particle board to the Asia-Pacific markets, with 229 thousand m3 in the year 2010.
Table 114. Exports of particle board, in thousand m3, 1992-2010.
|
Country |
1992 |
2000 |
2010 |
|
Australia |
30 |
|
|
|
China |
3 |
2 |
1 |
|
Hong Kong |
43 |
34 |
34 |
|
India |
0 |
|
|
|
Indonesia |
116 |
222 |
214 |
|
Japan |
1 |
|
|
|
Korea Rep |
0 |
|
|
|
Malaysia |
50 |
50 |
30 |
|
Myanmar |
|
|
|
|
New Zealand |
71 |
104 |
98 |
|
Papua New Guinea |
|
|
|
|
Philippines |
3 |
2 |
2 |
|
Singapore |
62 |
|
|
|
Solomon Islands |
|
|
|
|
Thailand |
|
|
|
|
Rest of the Asia-Pacific |
8 |
1 |
1 |
|
Asia Pacific |
387 |
415 |
379 |
|
Canada |
2062 |
2536 |
3341 |
|
Chile |
103 |
95 |
57 |
|
European Union |
421 |
594 |
958 |
|
Russia |
36 |
27 |
29 |
|
United States |
612 |
405 |
361 |
|
Rest of the World |
1143 |
1121 |
1049 |
|
World |
4764 |
5193 |
6175 |
|
Share |
8% |
8% |
6% |
Table 115. Direction of trade in particle board, in thousand m3, 2010.
|
Exporters |
Indonesia |
Asia Pacific |
Canada |
European Union |
United States |
Rest of the World |
Total |
|
Korea Rep |
31 |
31 |
28 |
19 |
134 |
158 |
370 |
|
China |
102 |
102 |
5 |
39 |
75 |
20 |
241 |
|
Japan |
8 |
8 |
40 |
7 |
12 |
|
67 |
|
Hong Kong |
1 |
1 |
|
|
7 |
27 |
35 |
|
Singapore |
18 |
18 |
|
3 |
1 |
|
22 |
|
Asia Pacific |
160 |
160 |
73 |
68 |
229 |
205 |
735 |
|
Canada |
1 |
1 |
|
2 |
82 |
|
85 |
|
European Union |
5 |
5 |
15 |
|
8 |
392 |
420 |
|
United States |
|
|
2896 |
76 |
|
403 |
3375 |
|
Rest of the World |
30 |
30 |
357 |
809 |
41 |
|
1237 |
|
Total |
196 |
196 |
3341 |
955 |
360 |
1000 |
5852 |
Forecasts of world-wide fibreboard consumption to the year 2010 are given in Table 116. The Asia-Pacific region's consumption is expected to increase from 3.8 million m3 in 1992 to 4.1 million in the year 2000 and 5.0 million in 2010. This implies an annual increase of 1.8% between 1992 and 2010, down from 11% between 1982 and 1992. The Asia-Pacific region's share of the world's total will rise from 19% in 1992 to 22% in the year 2000 and 23% in 2010.
Table 116. Consumption of fibreboard, in thousand m3, 1992-2010.
|
Country |
1992 |
2000 |
2010 |
|
Australia |
76 |
83 |
102 |
|
China |
1777 |
1857 |
2586 |
|
Hong Kong |
8 |
8 |
10 |
|
India |
45 |
31 |
24 |
|
Indonesia |
1 |
2 |
2 |
|
Japan |
1055 |
1172 |
1212 |
|
Korea Rep |
418 |
475 |
540 |
|
Malaysia |
3 |
3 |
3 |
|
Myanmar |
|
|
|
|
New Zealand |
164 |
208 |
202 |
|
Papua New Guinea |
0 |
|
|
|
Philippines |
36 |
35 |
45 |
|
Singapore |
46 |
65 |
77 |
|
Solomon Islands |
0 |
|
|
|
Thailand |
139 |
169 |
175 |
|
Rest of the Asia-Pacific |
20 |
24 |
31 |
|
Asia Pacific |
3788 |
4133 |
5008 |
|
Canada |
545 |
606 |
567 |
|
Chile |
118 |
139 |
134 |
|
European Union |
2917 |
3227 |
3778 |
|
Russia |
3655 |
3040 |
3395 |
|
United States |
6658 |
5960 |
6781 |
|
Rest of the World |
1987 |
1947 |
2346 |
|
World |
19664 |
19053 |
22008 |
|
Share |
19% |
22% |
23% |
China, Japan, and the Republic of Korea are expected to remain the top three consumers of fibreboard. China's consumption is projected to increase from 1.8 million m3 in 1992 to about 2.6 million in the year 2010. Consumption of fibreboard in Japan is likely to rise from 1.1m3 to 1.2 million between 1992 and the year 2010. The Republic of Korea will also experience a faster growth of its fibreboard consumption by the year 2010. The combined consumption of those three countries will account for more than 87% of the total regional demand for fibreboard.
Table 117 reports the production of fibreboard by country and territory for the period 1992-2010. For the Asia-Pacific, production is projected to increase from 3.6 million m3 in 1992 to 4.9 million in 2010. The region's world share will be up moderately from 18% in 1992 to 21% in 2000 and 22% in 2010.
Among all countries, China will lead in fibreboard production over the next two decades, followed by Japan and New Zealand. China is expected to be largely self-sufficient in supply, and production is forecast to increase from 1.5 million m3 to 2.0 million in 2010. Japan's fibreboard production is likely to increase more than 22%, from 929 thousand m3 in 1992 to 1.1 million by the year 2010. For New Zealand, the production is expected to reach 0.6 million m3 by 2010.
The region's imports (Tables 118) are expected to increase between 1992 and 2010, from 722 thousand m3 to 1 million. The region's share of the world's total, in turn, would decrease from 46% in 1992 to 32% in 2010. The largest importer of fibreboard in the region in 2010 would be China (568 thousand). The imports of China are expected to account for about 56% of the region's total. Other important importers of fibreboard in the region include the Republic of Korea with 96 m3 thousand, Japan with 79 thousand, Singapore with 77 thousand and Australia with 63 thousand.
Table 117. Production of fibreboard, in thousand m3, 1992-2010.
|
Country |
1992 |
2000 |
2010 |
|
Australia |
99 |
174 |
343 |
|
China |
1482 |
1486 |
2018 |
|
Hong Kong |
|
|
|
|
India |
46 |
28 |
11 |
|
Indonesia |
1 |
56 |
54 |
|
Japan |
929 |
1077 |
1132 |
|
Korea Rep |
354 |
390 |
443 |
|
Malaysia |
|
0 |
0 |
|
Myanmar |
|
|
|
|
New Zealand |
524 |
591 |
631 |
|
Papua New Guinea |
|
|
|
|
Philippines |
36 |
33 |
38 |
|
Singapore |
|
|
|
|
Solomon Islands |
|
|
|
|
Thailand |
148 |
189 |
186 |
|
Rest of the Asia-Pacific |
16 |
0 |
5 |
|
Asia Pacific |
3635 |
4023 |
4863 |
|
Canada |
672 |
842 |
931 |
|
Chile |
161 |
175 |
156 |
|
European Union |
2596 |
2892 |
3968 |
|
Russia |
3726 |
3096 |
3457 |
|
United States |
6880 |
6148 |
6802 |
|
Rest of the World |
2338 |
1876 |
1833 |
|
World |
20008 |
19053 |
22009 |
|
Share |
18% |
21% |
22% |
The region exports are projected to grow but remain small, accounting for about 27% of the global exports in 2010. New Zealand will continue to be the largest exporters within the region. It is expected that New Zealand's fibreboard exports will increase from slightly less than 360 thousand m3 in 1992 to 430 thousand by the year 2010 (Table 119). While exports from Australia are likely to more than double from 118 to 304 thousand m3 in twenty years, Indonesia's exports are expected to increase to 54 thousand m3 by the year 2010, from almost none in 1992.
The direction of trade in fibreboard in the year 2010 for the major importers and exporters are shown in Table 120. The major suppliers within the region will continue to be New Zealand and Indonesia as mentioned above. The main destinations of the exports from those two countries have been and will still be the countries in the same region. The largest importer for both New Zealand and Indonesia exports is China, with about one-half of the region's total imports of fibreboard from the two countries. Outside the region, United States is expected to continue to be the largest supplier of fibreboard to the Asia-Pacific markets, with 334 thousand m3 in 2010.
Table 118. Imports of fibreboard, in thousand m3, 1992-2010.
|
Country |
1992 |
2000 |
2010 |
|
Australia |
95 |
96 |
63 |
|
China |
295 |
371 |
568 |
|
Hong Kong |
32 |
72 |
71 |
|
India |
|
3 |
13 |
|
Indonesia |
|
1 |
3 |
|
Japan |
155 |
96 |
79 |
|
Korea Rep |
64 |
85 |
96 |
|
Malaysia |
3 |
3 |
3 |
|
Myanmar |
|
0 |
0 |
|
New Zealand |
|
|
|
|
Papua New Guinea |
0 |
|
|
|
Philippines |
0 |
2 |
7 |
|
Singapore |
57 |
65 |
77 |
|
Solomon Islands |
0 |
|
|
|
Thailand |
17 |
|
|
|
Rest of the Asia-Pacific |
4 |
43 |
37 |
|
Asia Pacific |
722 |
837 |
1017 |
|
Canada |
150 |
96 |
70 |
|
Chile |
0 |
|
|
|
European Union |
197 |
718 |
433 |
|
Russia |
2 |
2 |
1 |
|
United States |
270 |
346 |
496 |
|
Rest of the World |
217 |
910 |
1203 |
|
World |
1558 |
2908 |
3219 |
|
Share |
46% |
29% |
32% |
Table 119. Exports of fibreboard, in thousand m3, 1992-2010.
|
Country |
1992 |
2000 |
2010 |
|
Australia |
118 |
187 |
304 |
|
China |
0 |
|
|
|
Hong Kong |
38 |
64 |
60 |
|
India |
1 |
|
|
|
Indonesia |
|
56 |
54 |
|
Japan |
29 |
|
|
|
Korea Rep |
0 |
|
|
|
Malaysia |
|
|
|
|
Myanmar |
|
|
|
|
New Zealand |
360 |
382 |
430 |
|
Papua New Guinea |
|
|
|
|
Philippines |
|
|
|
|
Singapore |
11 |
|
|
|
Solomon Islands |
|
|
|
|
Thailand |
26 |
19 |
12 |
|
Rest of the Asia-Pacific |
|
19 |
11 |
|
Asia Pacific |
583 |
727 |
871 |
|
Canada |
277 |
332 |
434 |
|
Chile |
43 |
36 |
22 |
|
European Union |
382 |
382 |
623 |
|
Russia |
73 |
58 |
63 |
|
United States |
492 |
535 |
516 |
|
Rest of the World |
558 |
839 |
690 |
|
World |
2408 |
2908 |
3219 |
|
Share |
24% |
25% |
27% |
Table 120. Direction of trade in fibreboard, in thousand m3, 2010.
Newsprint
Printing and writing paper
Other paper and paperboard
The Asia-Pacific region's paper and paperboard consumption is expected to nearly double between 1992 and 2010, from 69 million metric tons to about 128 million (Figure 29). This implies an average annual growth rate of 3.5%. Over the same period, the world total consumption of paper and paperboard is projected to increase from 238 million metric tons in 1992 to 382 million in the year 2010. Thus, the Asia-Pacific region's share of the world total would rise from 29% in 1992 to 33% by the year 2010.
The 1992 distribution of the region's consumption was: newsprint - 11%, printing and writing paper - 29%, and other paper and paperboard - 60%. By the year 2010, this distribution is forecast to change to: newsprint - 10%, printing and writing paper - 36%, and other paper and paperboard - 54% (Figure 29).
The world prices for paper and paperboard, in 1992 US dollar, are in Figure 30. Historically, prices for newsprint, printing and writing paper, and other paper and paperboard have been parallel. This trend is likely to continue over the next two decades, with all prices changing little from 1992 to 2010. The newsprint price is projected to increase from $577 to $594 per metric ton between 1992 and the year 2010, the price of printing and writing paper from $948 to $932, and that of other paper and paperboard from $833 to $844.
Figure 30. Real world price of paper and paperboard, 1962-2010.
Although China's consumption of paper and paperboard is expected to more than double from 1992 to 2010, Japan should still be the largest consumer in the region. Other countries which will have sizeable increases in consumption include the Republic of Korea, Indonesia, India, Australia, Thailand and Malaysia.
Table 121 shows the projections of world-wide newsprint consumption between 1992 and 2010. Consumption of newsprint in the Asia-Pacific region is expected to increase from 7.6 million metric tons in 1992 to 10 million in the year 2000 and 13 million in 2010. This represents an annual growth of 3.1% between 1992 and 2010 period, similar to 3.7% for the 1982-92 period. The Asia-Pacific region's share of the world's total will increase slightly from 24% in 1992 to 26% in the year 2000 and 28% in 2010.
Table 121. Consumption of newsprint, in thousand metric tons, 1992-2010.
|
Country |
1992 |
2000 |
2010 |
|
Australia |
658 |
780 |
926 |
|
China |
877 |
1365 |
2028 |
|
Hong Kong |
212 |
290 |
389 |
|
India |
495 |
676 |
925 |
|
Indonesia |
112 |
170 |
246 |
|
Japan |
3715 |
4421 |
5249 |
|
Korea Rep |
593 |
915 |
1339 |
|
Malaysia |
202 |
301 |
472 |
|
Myanmar |
11 |
16 |
22 |
|
New Zealand |
101 |
121 |
146 |
|
Papua New Guinea |
0 |
|
|
|
Philippines |
127 |
162 |
216 |
|
Singapore |
101 |
156 |
233 |
|
Solomon Islands |
|
|
|
|
Thailand |
238 |
352 |
511 |
|
Rest of the Asia Pacific |
146 |
208 |
288 |
|
Asia Pacific |
7588 |
9932 |
12992 |
|
Canada |
236 |
270 |
319 |
|
Chile |
46 |
68 |
94 |
|
European Union |
7691 |
9211 |
11352 |
|
Russia |
871 |
94 |
905 |
|
United States |
12154 |
14481 |
16856 |
|
Rest of the World |
2397 |
3727 |
4714 |
|
World |
30983 |
38483 |
47231 |
|
Share |
24% |
26% |
28% |
Among them, Japan and China would be the two largest consumers of newsprint in the region. Consumption in Japan is likely to continue to grow between 1992 and 2010, from 3.7 million metric tons to 5.2 million. China's consumption is projected to more than double from 877 thousand metric tons in 1992 to about 2.0 million in the year 2010. Besides Japan and China, the Republic of Korea, Australia, India, Thailand, and Malaysia are also expected to be important consumers of newsprint in the region by the year 2010. Except Australia, all of them would experience the fastest growth, and more than double their newsprint consumption by the year 2010.
The region's world share of production would stay at about 20% from now to the year 2010 (Table 122). The production of newsprint is projected to increase from 6 million metric tons in 1992 to 7.8 million in the year 2000 and 10 million by the year 2010. One half will be produced in Japan by the year 2010, compared to 54% in 1992. Japan has been in the past and will continue to be the dominant producer of newsprint in the Asia-Pacific, due to its large domestic market. Japanese production would grow faster than its consumption. As a result, Japan is expected to become fully self-sufficient in the future, producing 99.8% of its total domestic consumption by 2010. Ranked by 2010 production levels, other major producers of newsprint are China with 1.5 million metric tons, the Republic of Korea with 1.1 million, Australia with 824 thousand, and India with 542 thousand.
Table 122. Production of newsprint, in thousand metric tons, 1992-2010.
|
Country |
1992 |
2000 |
2010 |
|
China |
603 |
1016 |
1457 |
|
Hong Kong |
|
|
|
|
India |
340 |
446 |
542 |
|
Indonesia |
169 |
233 |
314 |
|
Japan |
3255 |
4192 |
5240 |
|
Korea Rep |
613 |
716 |
1120 |
|
Malaysia |
|
|
|
|
Myanmar |
|
15 |
20 |
|
New Zealand |
379 |
334 |
315 |
|
Papua New Guinea |
|
|
|
|
Philippines |
125 |
157 |
204 |
|
Singapore |
|
|
|
|
Solomon Islands |
|
|
|
|
Thailand |
|
116 |
222 |
|
Rest of the Asia-Pacific |
60 |
0 |
119 |
|
Asia Pacific |
5990 |
7844 |
10376 |
|
Canada |
8931 |
8798 |
7403 |
|
Chile |
161 |
145 |
140 |
|
European Union |
6942 |
9054 |
11223 |
|
Russia |
915 |
841 |
982 |
|
United States |
6424 |
9090 |
12548 |
|
Rest of the World |
2648 |
2711 |
4559 |
|
World |
32011 |
38482 |
47231 |
|
Share |
19% |
20% |
22% |
Table 123 shows imports of newsprint by country and territory, between 1992 and 2010. The total imports by countries in the Asia-Pacific region are expected to increase to 3 million metric tons in the year 2010 from 2 million in 1992. But the expansion of imports would be slower with an average annual growth rate of 3.5% between 1992 and 2000 and 1.6% between 2000 and 2010, compared to 4% from 1982 to 1992. The region's world share of imports would, however, rise from 18% in 1992 to around 27% in 2010. China would replace Japan to become the largest importer in the Asia-Pacific region, with imports doubling from 277 thousand metric tons in 1992 to 572 thousand in 2010. Japan's imports are projected to fall from 544 to 218 thousand metric tons between 1992 and 2010. Like China, Malaysia would also experience a fast growth in newsprint consumption, more than doubling it between 1992 and 2010.
As shown in Table 124, the exports of newsprint by countries in the Asia-pacific region are projected to slightly increase from 485 thousand metric tons in 1992 to 611 thousand in the year 2010. The region's share of the world total exports would remain insignificant at about 4-5%. The main exporters in 2010 would be Japan (209 thousand m3) and New Zealand (184 thousand).
Table 123. Imports of newsprint, in thousand metric tons, 1992-2010
|
Country |
1992 |
2000 |
2010 |
|
China |
277 |
351 |
572 |
|
Hong Kong |
223 |
290 |
389 |
|
India |
155 |
230 |
383 |
|
Indonesia |
22 |
2 |
4 |
|
Japan |
544 |
361 |
218 |
|
Korea Rep |
0 |
199 |
219 |
|
Malaysia |
202 |
301 |
472 |
|
Myanmar |
11 |
1 |
2 |
|
New Zealand |
6 |
9 |
15 |
|
Papua New Guinea |
0 |
|
|
|
Philippines |
2 |
4 |
12 |
|
Singapore |
105 |
156 |
233 |
|
Solomon Islands |
|
|
|
|
Thailand |
238 |
239 |
292 |
|
Rest of the Asia-Pacific |
86 |
436 |
314 |
|
Asia Pacific |
2083 |
2741 |
3227 |
|
Canada |
|
|
|
|
Chile |
0 |
|
|
|
European Union |
1046 |
1810 |
1809 |
|
Russia |
1 |
1 |
0 |
|
United States |
6658 |
6554 |
5423 |
|
Rest of the World |
1638 |
2193 |
1550 |
|
World |
11426 |
13299 |
12009 |
|
Share |
18% |
21% |
27% |
Table 124. Exports of newsprint, in thousand metric tons, 1992-2010
|
Country |
1992 |
2000 |
2010 |
|
China |
3 |
2 |
1 |
|
Hong Kong |
11 |
|
|
|
India |
|
|
|
|
Indonesia |
79 |
65 |
71 |
|
Japan |
84 |
133 |
209 |
|
Korea Rep |
20 |
|
|
|
Malaysia |
0 |
|
|
|
Myanmar |
|
|
|
|
New Zealand |
284 |
223 |
184 |
|
Papua New Guinea |
|
|
|
|
Philippines |
|
|
|
|
Singapore |
4 |
|
|
|
Solomon Islands |
|
|
|
|
Thailand |
|
3 |
2 |
|
Rest of the Asia-Pacific |
|
228 |
144 |
|
Asia Pacific |
485 |
653 |
611 |
|
Canada |
8695 |
8529 |
7084 |
|
Chile |
115 |
76 |
46 |
|
European Union |
1209 |
1653 |
1680 |
|
Russia |
45 |
48 |
78 |
|
United States |
928 |
1164 |
1116 |
|
Rest of the World |
974 |
1177 |
1395 |
|
World |
12451 |
13299 |
12009 |
|
Share |
4% |
5% |
5% |
The directions of trade world-wide in newsprint in the year 2010 are reported in Table 125. China would be the main importer of newsprint both from the Asia-Pacific region and from other parts of the world. Japan is expected to surpass New Zealand to become the largest exporter of newsprint within the region. The main importer for Japan's exports would be China, while it is forecast that Australia would import mainly from New Zealand in 2010. Canada is expected to maintain its dominant position of newsprint exporter to the Asia-Pacific region with 879 thousand metric tons, followed by the United States exporting 758 thousand and the European Union exporting 661 thousand. The imports from Asia-Pacific countries are expected to account for only 15% of total imports in 2010, down from 17% in 1992.
Table 125. Direction of trade in newsprint, in thousand metric tons, 2010.
Consumption of printing and writing paper in the Asia-Pacific region is expected to increase from 20 million metric tons in 1992 to 33 million in 2000 and 46 million in 2010 (Table 126). This represents an annual increase of 6.1% between 1992 and 2000 and 3.2% from 2000 to 2010, down from 15% growth between 1982 and 1992. The Asia-Pacific region's share of the world's total will rise from 29% in 1992 to 33% in 2000 and 36% in 2010.
While consumption is projected to increase in all countries within the region, Japan and China will continue to be the main consumers of printing and writing paper by 2010. China's consumption is projected to more than double between 1992 and 2010, from 5.9 million metric tons to about 15.0 million, while consumption of printing and writing paper in Japan is likely to double over the same period, from 9.4 million metric tons to 18.8 million. The combined consumption of the two countries would account for more than 70 % of the total printing and writing paper consumption in the region from 1992 to 2010.
By 2010, other important consumers of printing and writing paper in the region would be the Republic of Korea (2.7 million metric tons), Indonesia (1.8), India (1.6) and Australia (1.5). Of them, Indonesia and the Republic of Korea would experience a much faster growth, and more than double their printing and writing paper consumption by the year 2010.
Table 126. Consumption of printing and writing paper, in thousand metric tons, 1992-2010.
|
Country |
1992 |
2000 |
2010 |
|
Australia |
763 |
1146 |
1472 |
|
China |
5888 |
9629 |
14981 |
|
Hong Kong |
187 |
301 |
462 |
|
India |
1099 |
1299 |
1643 |
|
Indonesia |
588 |
1067 |
1801 |
|
Japan |
9443 |
15611 |
18821 |
|
Korea Rep |
987 |
1763 |
2734 |
|
Malaysia |
273 |
503 |
686 |
|
Myanmar |
6 |
344 |
556 |
|
New Zealand |
165 |
222 |
295 |
|
Papua New Guinea |
0 |
|
|
|
Philippines |
184 |
266 |
423 |
|
Singapore |
184 |
405 |
704 |
|
Solomon Islands |
|
|
|
|
Thailand |
166 |
280 |
450 |
|
Rest of the Asia-Pacific |
228 |
363 |
556 |
|
Asia Pacific |
20161 |
33198 |
45582 |
|
Canada |
2324 |
3050 |
3294 |
|
Chile |
82 |
152 |
201 |
|
European Union |
19483 |
25634 |
31315 |
|
Russia |
1041 |
993 |
1202 |
|
United States |
22109 |
30802 |
37220 |
|
Rest of the World |
4790 |
6874 |
9321 |
|
World |
69990 |
100703 |
128135 |
|
Share |
29% |
33% |
36% |
Total production of the Asia-Pacific region is forecast to more than double and amount to 44 million metric tons in 2010 (Table 127) so that the region would be about 96% self-sufficient, compared to 94% in 1992. Japan with 20 million metric tons and China with 14 million would be the largest producers in the region by 2010. While China would reach a self-sufficiency of nearly 95%, Japan is expected to remain a net exporter. There are two other countries with production exceeding 1.5 million metric tons. The Republic of Korea and Indonesia are projected to more than double their production of printing and writing paper. The production in the top four producing countries is expected to be 90% of the region's total, remaining the same level in 1992.
The Asia-Pacific region has been a net importer of printing and writing paper in the last thirty years. This trend is not expected to change over the next two decades. The total imports by countries in the Asia-Pacific region are projected to increase from 2 million metric tons in 1992 to 3 million in the year 2000 and 4 million in 2010 (Table 128). But the expansion of imports would be slower with an average annual growth rate of 5% between 1992 and 2000 and 3% between 2000 and 2010, compared to 15% from 1982 to 1992. This is mainly due to a strong increase of production within the region. The world share of the Asia-Pacific imports would rise significantly from 11% in 1992 to 29% in 2000 and 37% in 2010. The leading importers would include Hong Kong with 804 thousand metric tons, China with 741 thousand and Singapore with 705 thousand.
Table 127. Production of printing and writing paper, in thousand metric tons, 1992-2010.
|
Country |
1992 |
2000 |
2010 |
|
Australia |
304 |
818 |
1223 |
|
China |
5531 |
9214 |
14303 |
|
Hong Kong |
|
|
|
|
India |
1060 |
1185 |
1183 |
|
Indonesia |
735 |
1065 |
1798 |
|
Japan |
9610 |
16476 |
20357 |
|
Korea Rep |
1040 |
1719 |
2579 |
|
Malaysia |
162 |
338 |
406 |
|
Myanmar |
5 |
344 |
555 |
|
New Zealand |
8 |
0 |
0 |
|
Papua New Guinea |
|
|
|
|
Philippines |
144 |
213 |
370 |
|
Singapore |
|
|
|
|
Solomon Islands |
|
|
|
|
Thailand |
115 |
280 |
450 |
|
Rest of the Asia-Pacific |
160 |
335 |
414 |
|
Asia Pacific |
18874 |
31988 |
43639 |
|
Canada |
3567 |
4116 |
3581 |
|
Chile |
44 |
96 |
111 |
|
European Union |
22712 |
27154 |
32518 |
|
Russia |
996 |
1089 |
1344 |
|
United States |
20281 |
29692 |
36175 |
|
Rest of the World |
4909 |
6568 |
10768 |
|
World |
71383 |
100702 |
128135 |
|
Share |
26% |
32% |
34% |
Table 128. Imports of printing and writing paper, in thousand metric tons, 1992-2010.
|
Country |
1992 |
2000 |
2010 |
|
Australia |
496 |
327 |
248 |
|
China |
518 |
520 |
741 |
|
Hong Kong |
223 |
630 |
804 |
|
India |
43 |
114 |
460 |
|
Indonesia |
18 |
2 |
4 |
|
Japan |
72 |
133 |
80 |
|
Korea Rep |
51 |
178 |
291 |
|
Malaysia |
168 |
171 |
283 |
|
Myanmar |
1 |
0 |
0 |
|
New Zealand |
160 |
222 |
295 |
|
Papua New Guinea |
0 |
53 |
52 |
|
Philippines |
40 |
|
|
|
Singapore |
224 |
405 |
705 |
|
Solomon Islands |
|
|
|
|
Thailand |
52 |
0 |
0 |
|
Rest of the Asia-Pacific |
69 |
359 |
349 |
|
Asia Pacific |
2135 |
3115 |
4312 |
|
Canada |
245 |
520 |
752 |
|
Chile |
40 |
56 |
91 |
|
European Union |
1320 |
1575 |
1823 |
|
Russia |
52 |
0 |
0 |
|
United States |
2879 |
2203 |
2160 |
|
Rest of the World |
2170 |
3160 |
2621 |
|
World |
8841 |
10629 |
11758 |
|
Share |
11% |
29% |
37% |
As shown in Table 129, the exports of printing and writing paper by countries in the Asia-Pacific region are projected to nearly triple between 1992 and 2010, from 848 thousand metric tons to 2.4 million. The region's share of the world total exports would increase from 10% to 20% over the same period. The dominant exporter in the region would still be Japan exporting some 1.6 million metric tons of printing and writing paper in the year 2010. That is expected to account for about 68% of the Asia-Pacific region's total exports. The forecasts show that Hong Kong would also export a significant volume of printing and writing paper. Since Hong Kong does not have any production of printing and writing paper, they are expected to be transit exports from Japan (Table 130).
Table 129. Exports of printing and writing paper, in thousand metric tons, 1992-2010
|
Country |
1992 |
2000 |
2010 |
|
Australia |
37 |
|
|
|
China |
161 |
106 |
63 |
|
Hong Kong |
36 |
329 |
343 |
|
India |
4 |
|
|
|
Indonesia |
165 |
|
|
|
Japan |
239 |
997 |
1616 |
|
Korea Rep |
104 |
135 |
136 |
|
Malaysia |
57 |
6 |
3 |
|
Myanmar |
|
|
|
|
New Zealand |
3 |
|
|
|
Papua New Guinea |
|
|
|
|
Philippines |
0 |
|
|
|
Singapore |
40 |
|
|
|
Solomon Islands |
|
|
|
|
Thailand |
1 |
|
|
|
Rest of the Asia-Pacific |
1 |
331 |
207 |
|
Asia Pacific |
848 |
1904 |
2368 |
|
Canada |
1488 |
1586 |
1040 |
|
Chile |
2 |
|
|
|
European Union |
3887 |
3095 |
3026 |
|
Russia |
7 |
96 |
142 |
|
United States |
1051 |
1093 |
1115 |
|
Rest of the World |
1293 |
2854 |
4067 |
|
World |
8576 |
10629 |
11758 |
|
Share |
10% |
18% |
20% |
The directions of trade in printing and writing paper in the year 2010 (Table 130) show Hong Kong as the main importer of printing and writing paper from the Asia-Pacific region, mostly from Japan, as in 1992 (Table 68). By 2010, Hong Kong would import 804 thousand metric tons of printing and writing paper. Nearly half of that amount is expected to be re-exported to other countries. On the other hand, China and Australia has been and would continue to be the main importers of printing and writing paper from other parts of the world, mostly from the European Union.
Japan is expected to be the region major supplier, with about 75% of its exports heading to countries within the Asia-Pacific. Outside the region, the European Union is projected to remain the leading supplier of printing and writing paper to Asia-Pacific markets, although the quantities traded may decrease slightly by 2010. The United States is also projected to decrease its exports of printing and writing paper to the region by 30%.
Table 130. Direction of trade in printing and writing paper, in thousand metric tons, 2010.
Table 131 shows world-wide consumption of other paper and paperboard from 1992 to 2010. Consumption in the Asia-pacific region is expected to amount to 55 million metric tons by the year 2000 and 69 million by the year 2010, 34% and 71% more than in 1992. The region's share of world rise from 30% in 1992 to 31% in 2000 and 34% in 2010.
Table 131. Consumption of other paper and paperboard, in thousand m3, 1992-2010.
|
Country |
1992 |
2000 |
2010 |
|
Australia |
1269 |
1519 |
1738 |
|
China |
15341 |
20080 |
27173 |
|
Hong Kong |
745 |
957 |
1206 |
|
India |
1013 |
1088 |
1344 |
|
Indonesia |
1188 |
1660 |
2346 |
|
Japan |
15202 |
19914 |
22760 |
|
Korea Rep |
3700 |
5339 |
7355 |
|
Malaysia |
572 |
853 |
1157 |
|
Myanmar |
7 |
112 |
146 |
|
New Zealand |
283 |
336 |
392 |
|
Papua New Guinea |
11 |
12 |
13 |
|
Philippines |
502 |
634 |
796 |
|
Singapore |
308 |
481 |
648 |
|
Solomon Islands |
|
|
|
|
Thailand |
568 |
766 |
1028 |
|
Rest of the Asia-Pacific |
578 |
798 |
1115 |
|
Asia Pacific |
41287 |
54550 |
69217 |
|
Canada |
2859 |
3478 |
3899 |
|
Chile |
172 |
243 |
310 |
|
European Union |
31851 |
36783 |
41842 |
|
Russia |
5287 |
5156 |
5716 |
|
United States |
44927 |
54586 |
61920 |
|
Rest of the World |
10212 |
18640 |
23698 |
|
World |
136595 |
173435 |
206602 |
|
Share |
30% |
31% |
34% |
China, Japan and the Republic of Korea are expected to continue to be the main consumers other paper and paperboard by 2010. China's consumption is projected to nearly double between 1992 and 2010, from 15 million metric tons to about 27 million. Consumption of other paper and paperboard in Japan is likely to rise 49 % over the same period, from 15 million metric tons to about 23 million. Similarly, the Republic of Korea will also experience a fast growth period, and nearly double its consumption of other paper and paperboard by the year 2010. Figure 31 shows the consumption of other paper and paperboard in the Asia-Pacific region from 1962 to 2010. While China's share of the regional consumption is expected to increase from 37% to 39%, that of Japan would decline from 37% to 33% between 1992 and 2010. There are six other countries with consumption exceeding 1 million tons in 2010: Indonesia (2.3), Australia (1.7), India (1.3), Hong Kong (1.2), Malaysia (1.1) and Thailand (1.1).
Figure 31. Consumption of other paper and paperboard in the Asia-Pacific region, 1962-2010.
Production of other paper and paperboard in the Asia-Pacific region is projected to rise from 39 million metric tons in 1992 to 50 million in the year 2000 and 63 million in 2010. The region's production will represent 29% of the world's total in the year 2000 and 30% in 2010, up a little from 27% in 1992 (Table 132).
Japan, China and the Republic of Korea are expected to be the largest producers. By the year 2010, Japan will still be the leading producer in the region. China's production is forecast to nearly double from 14 million metric tons in 1992 to 24 million by the year 2010. During the same period, other paper and paperboard production in Japan would rise from about 16 million metric tons to 24 million, and Japan would continue to be self-sufficient, meanwhile, the Republic of Korea's production is projected to increase from 3.9 million metric tons to 6.7 million.
Table 132. Production of other paper and paperboard, in thousand m3, 1992-2010.
|
Country |
1992 |
2000 |
2010 |
|
China |
13808 |
17734 |
23679 |
|
Hong Kong |
115 |
3 |
3 |
|
India |
1000 |
1050 |
1190 |
|
Indonesia |
1359 |
1411 |
1960 |
|
Japan |
15459 |
20743 |
24410 |
|
Korea Rep |
3851 |
4957 |
6733 |
|
Malaysia |
245 |
377 |
382 |
|
Myanmar |
6 |
111 |
142 |
|
New Zealand |
345 |
347 |
356 |
|
Papua New Guinea |
|
12 |
13 |
|
Philippines |
301 |
368 |
422 |
|
Singapore |
85 |
376 |
770 |
|
Solomon Islands |
|
|
|
|
Thailand |
462 |
639 |
775 |
|
Rest of the Asia Pacific |
473 |
593 |
0 |
|
Asia Pacific |
38791 |
50222 |
62774 |
|
Canada |
4087 |
4741 |
4381 |
|
Chile |
142 |
96 |
72 |
|
European Union |
31102 |
36271 |
41025 |
|
Russia |
5368 |
5244 |
5860 |
|
United States |
48456 |
58951 |
66237 |
|
Rest of the World |
14096 |
17911 |
26253 |
|
World |
142042 |
173435 |
206602 |
|
Share |
27% |
29% |
30% |
The Asia-Pacific region has been a net importer of other paper and paperboard for the last thirty years. This trend is expected to continue during the next two decades. Tables 133 and 134 summarize the world-wide import and export trends. The Asia-Pacific region's imports are projected to increase 50%, from 6.4 million metric tons in 1992 to 9.6 million in the year 2010, while exports would decline from 3.9 to 3.2 million metric tons, due mainly to the accelerating consumption within the region, meanwhile the region's share of world's total imports of other paper and paperboard is expected to fluctuate between 36% and 44%, and the share of world's total exports to decline markedly from 22% to 14%. The projected leading importers in 2010 include China with 3.7 million metric tons and Hong Kong with 1.4 million.
Japan is forecast to continue to be the largest exporter with nearly 1.8 million metric tons of other paper and paperboard exports in 2010, about 58% of the regional total exports. Exports of China and Hong Kong are expected to decrease as domestic consumption increases.
Table 133. Imports of other paper and paperboard, in thousand m3, 1992-2010.
|
Country |
1992 |
2000 |
2010 |
|
China |
2129 |
2728 |
3724 |
|
Hong Kong |
1873 |
1192 |
1375 |
|
India |
15 |
38 |
154 |
|
Indonesia |
75 |
249 |
386 |
|
Japan |
591 |
302 |
181 |
|
Korea Rep |
238 |
382 |
621 |
|
Malaysia |
371 |
476 |
775 |
|
Myanmar |
1 |
1 |
3 |
|
New Zealand |
28 |
42 |
68 |
|
Papua New Guinea |
11 |
0 |
0 |
|
Philippines |
201 |
266 |
374 |
|
Singapore |
390 |
311 |
213 |
|
Solomon Islands |
|
|
|
|
Thailand |
176 |
190 |
291 |
|
Rest of the Asia-Pacific |
109 |
234 |
1153 |
|
Asia Pacific |
6382 |
6756 |
9602 |
|
Canada |
979 |
702 |
995 |
|
Chile |
67 |
146 |
238 |
|
European Union |
3442 |
4201 |
4723 |
|
Russia |
66 |
1 |
0 |
|
United States |
1327 |
1697 |
1579 |
|
Rest of the World |
4141 |
5515 |
4852 |
|
World |
16404 |
19018 |
21989 |
|
Share |
39% |
36% |
44% |
Table 134. Exports of other paper and paperboard, in thousand m3, 1992-2010.
|
Country |
1992 |
2000 |
2010 |
|
Australia |
187 |
328 |
483 |
|
China |
596 |
382 |
230 |
|
Hong Kong |
1243 |
237 |
172 |
|
India |
2 |
|
|
|
Indonesia |
246 |
|
|
|
Japan |
848 |
1131 |
1831 |
|
Korea Rep |
389 |
|
|
|
Malaysia |
44 |
|
|
|
Myanmar |
|
|
|
|
New Zealand |
90 |
52 |
32 |
|
Papua New Guinea |
|
|
|
|
Philippines |
0 |
|
|
|
Singapore |
167 |
206 |
335 |
|
Solomon Islands |
|
|
|
|
Thailand |
70 |
63 |
38 |
|
Rest of the Asia-Pacific |
4 |
28 |
38 |
|
Asia Pacific |
3886 |
2428 |
3160 |
|
Canada |
2207 |
1965 |
1477 |
|
Chile |
37 |
|
|
|
European Union |
3640 |
3689 |
3906 |
|
Russia |
147 |
88 |
144 |
|
United States |
4856 |
6062 |
5896 |
|
Rest of the World |
2657 |
4787 |
7407 |
|
World |
17430 |
19018 |
21989 |
|
Share |
22% |
13% |
14% |
Table 135 shows the projected direction of trade in other paper and paperboard world-wide in the year 2010. Compared to the 1992 levels (Table 79), Hong Kong's imports from China are expected to decline from 305 to 120 thousand metric tons, while imports from Japan would more than double. China's imports from Japan are projected to rise markedly from 144 to 350 thousand metric tons. Imports of the Republic of Korea are also expected to more than double. These three countries or territories would remain the top three importers of other paper and paperboard from Japan. In contrast, Asia-Pacific countries' imports from China would decline gradually over the next two decades.
Table 135. Direction of trade in other paper and paperboard, in thousand metric tons, 2010.
Outside the Asia-Pacific region, the United States and the European Union will continue to be the largest importers of other paper and paperboard from Japan. Exports of the United States to the Asia-Pacific countries are projected to almost double, from 1.7 million metric tons in 1992 to 2.8 million in the year 2010, while the European Union's exports would grow by 70%. The main destinations would be China, Hong Kong and Indonesia. The Asia-Pacific countries' imports from other regions are projected to account for about 84% of their total imports.
A recent alternative set of projections for countries and territories of the Asia-Pacific region is available in the recent Outlook for Global Forest Products Consumption, Production and Trade prepared for the FAO by Zhang et al. (1996). The present Asia-Pacific study was completed before the Global Outlook, with a similar methodology but with different assumptions, and a different model structure. The main difference is in the base year, 1992 for the Asia-Pacific study, and 1994 for the Global Outlook. Also, in terms of results, the model for the Global Outlook did not project the direction of trade between countries and territories.
After the Global Outlook was completed, the projections for the Asia-Pacific were re-done so that they would use similar assumptions regarding projected economic growth, and projected supply potential in each country and territory. Specifically, the assumptions of the Asia-Pacific study are similar to those of scenario 2 in the Global Outlook. Therefore, the two sets of forecasts are not independent. Nevertheless, there are differences between the two sets of forecasts. The main reason for the differences is the different base years.
For comparison, Table 136 shows the projected consumption to 2010 of the main product aggregates by country and territory, for the two studies. For the entire Asia-pacific region, consumption of fuelwood and charcoal is 10% lower in this study than in the lowest projection of the Global Outlook. For industrial roundwood, consumption in 2010 is 3.6% higher in this study than the highest projection of the Outlook. Sawnwood consumption is near the median projection of the Outlook. For wood-based panels, projected consumption is 19% lower than the lowest projection of the Outlook. And, the projected consumption of paper and paperboard is 11% lower in this study than the lowest projection of the Outlook.
Relative differences are sometimes larger for individual countries, most of the differences are attributable to the choice of the base year. For example, for China, paper and paperboard consumption in 1992 was estimated to be 22.1 million tons in 1992, and 29.8 million tons in 1994. Still, the projections of these two studies are both much lower than earlier projections (FAO 1991, 1994, 1995). The reason lies in part in the lower rates of economic growth assumed both in this study and in the Global Outlook, and in changes in methodology (Zhang and Buongiorno 1994).
It is believed that to get the best possible projections, the technical procedures on which this study relied must be supplemented by expert opinions concerning the situation in various countries and territories. Still, whatever adjustments are made to the forecasts, if they are integrated in the methodology used here, then the equilibrium calculation guarantees full consistency of forecasts of consumption, production, trade, and prices, within the Asia-Pacific and between the Asia-Pacific and the rest of the world.
Table 136. Comparison between consumption projections for the year 2010.
![]()
![]()
![]()
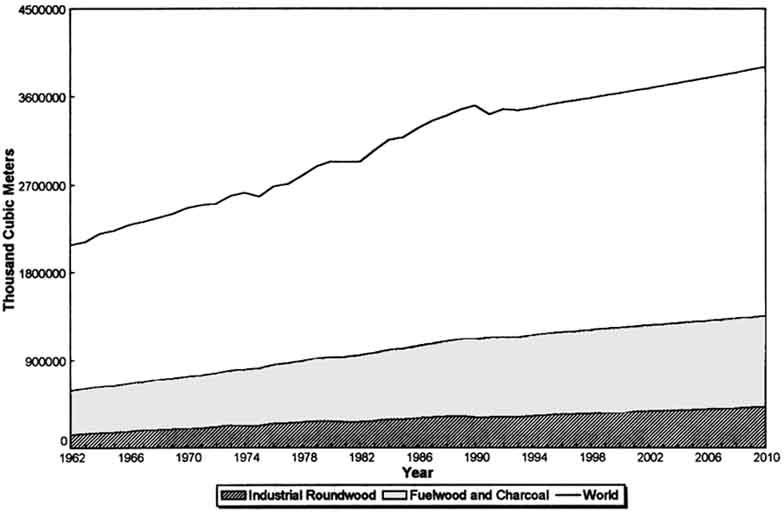
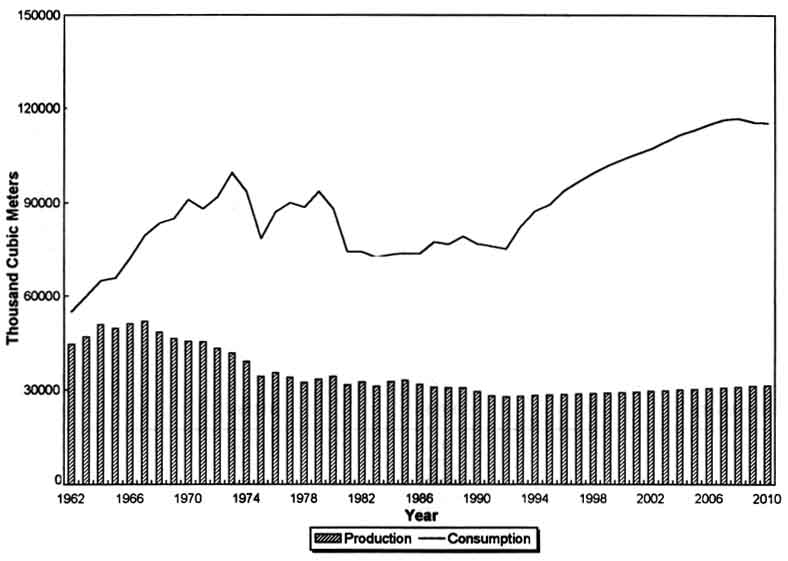
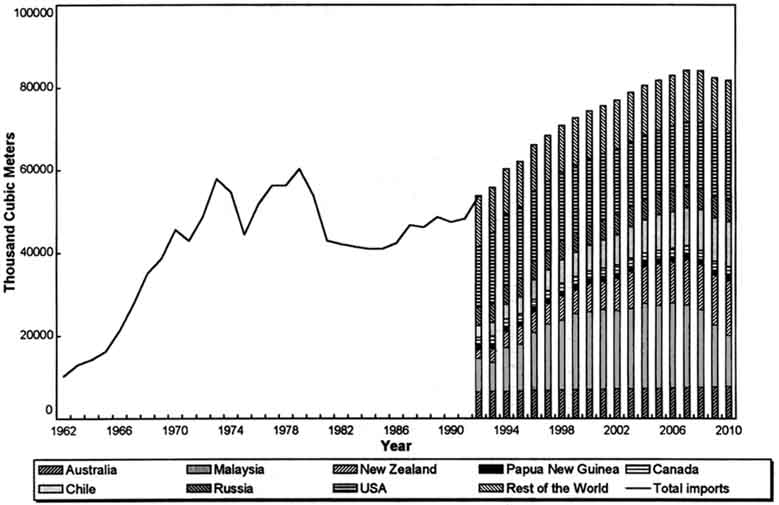
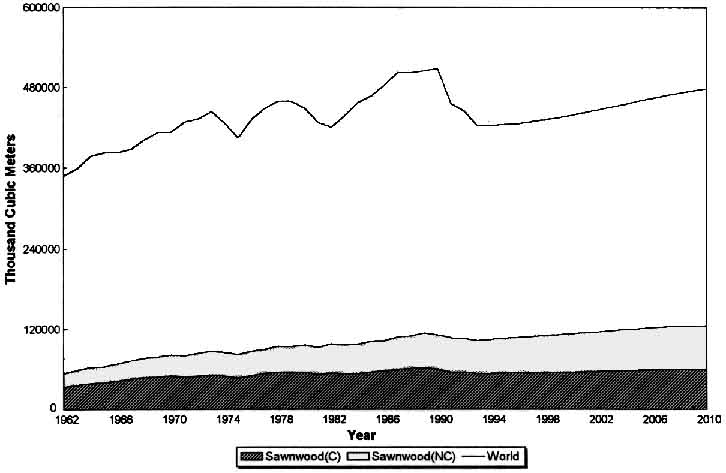
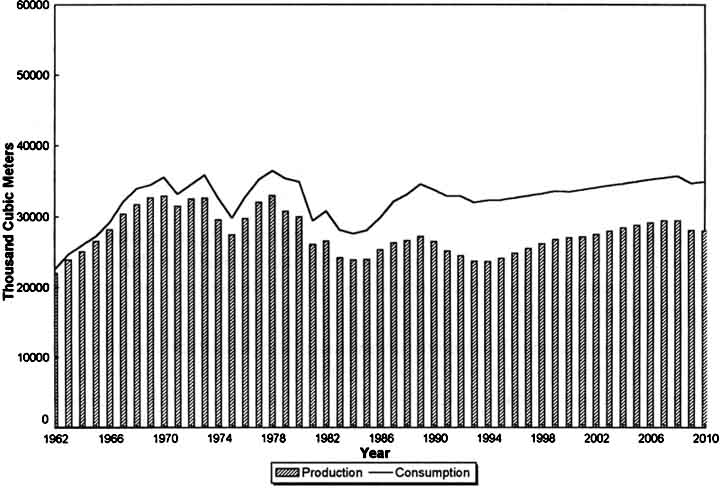
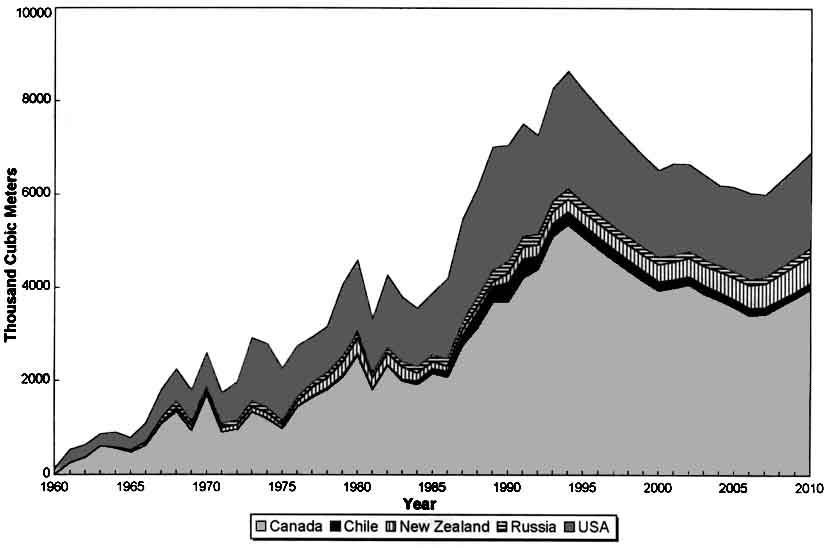
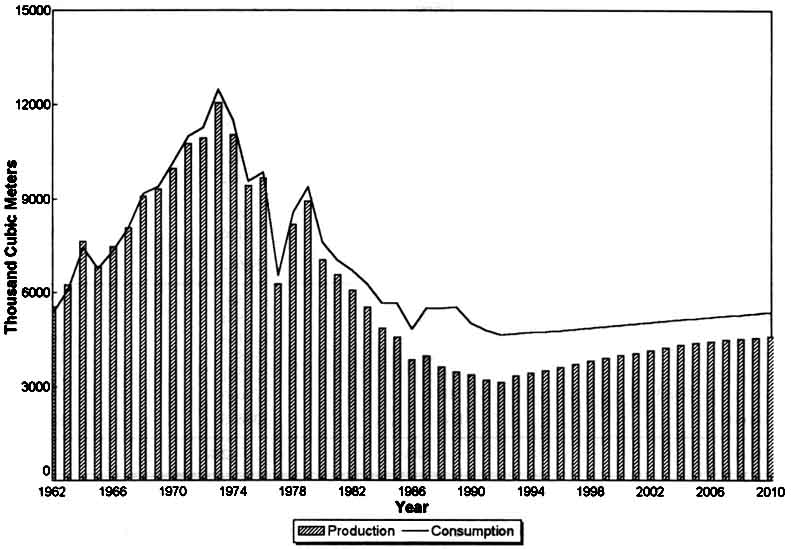
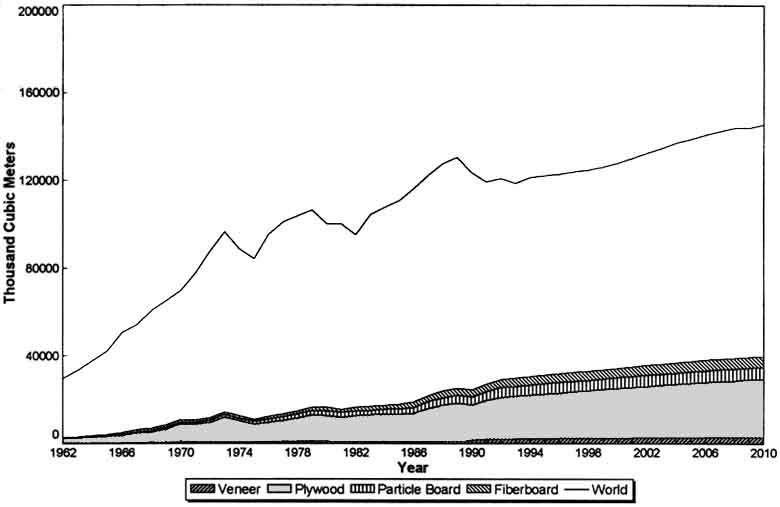
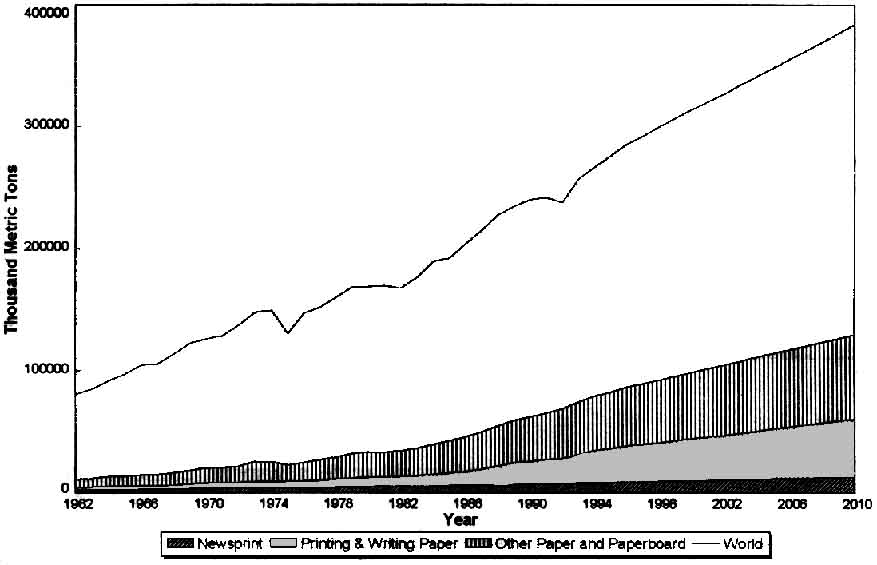
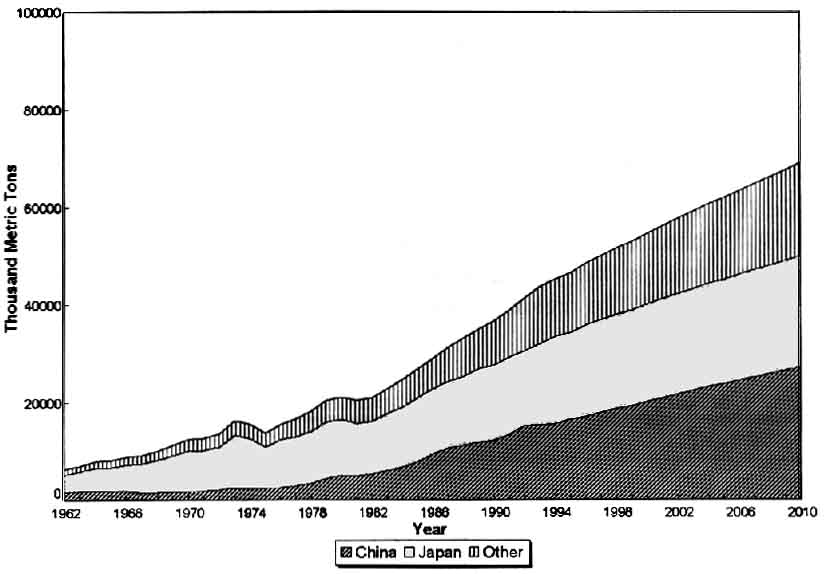