![]()
![]()
![]()
4.1 Forests and wooded lands in land use
4.2 Roundwood production potential
4.3 Roundwood fellings
4.4 Comparison between wood production potential and fellings: Industrial roundwood, fuelwood and total roundwood supply (SI = wood stock increment)
Table 1 provides the overall regional picture of forest resources and roundwood supply from 1990 up to 2010. Forest resources areas and roundwood supply are broken down by forest land use category: - production forests including natural exploitable forests and plantation forests; - other forests and wooded lands including low productive and open forests; - non forest lands including commercial tree crops and arable lands.
The 1995 status and the likely development up to 2010 are analysed below regarding the following aspects: (a) the forests and wooded lands in land use; (b) roundwood production potential (and growing stock); (c) roundwood fellings; and (d) comparison between roundwood production potential and roundwood (industrial, fuel and total) fellings.
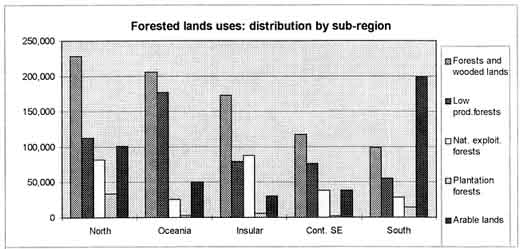
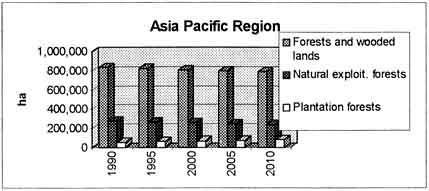
About 28 % of the total land area of the whole Asia Pacific region is covered with forests and wooded lands of which 31% are natural exploitable forests, 6% plantation forests and 61% are classified as low productive and open forests (Figure 1; Table 1).
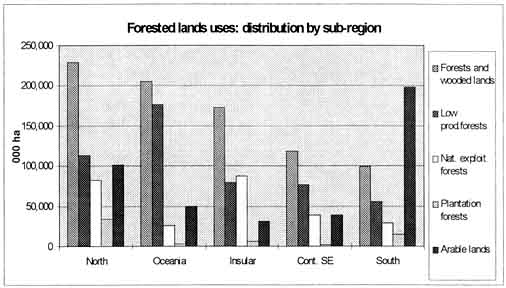
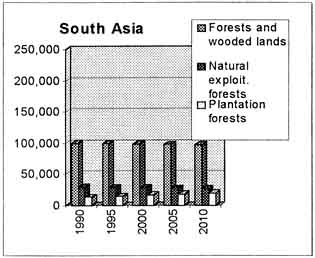
The distribution by sub-regions of the forests and wooded lands is as followed: 10% in South Asia, 14% in Continental S.E., 21% in Insular Asia, 25% in Oceania and Pacific, and 28% in North Asia. South-Asia and Continental South-East Asia are relatively poor in terms of forest cover.
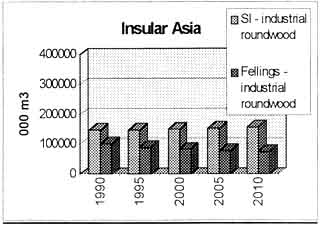
Regarding the exploitable forests, the distribution is somewhat different: 11% in South Asia, 15% in Continental S.E., 32% in Insular Asia, only 10% in Oceania-Pacific, and 31% in North Asia. Insular Asia is the most wealthy sub-region with natural exploitable forests.
Non forest lands (arable and commercial crops) contribute significantly to roundwood supply. About 15% of the total land area of the AP region are arable lands and tree commercial crop lands; these are equivalent to about 50% of the forests and wooded lands area. Trees on arable lands play a particularly important role in sub-regions where forested areas are relatively limited such as in South Asia.
Figure 1 - Comparative resource endowment of sub-regions (1995)
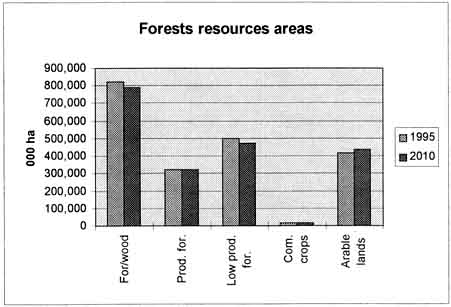
As a continuation of present trends, the total forests and wooded lands areas would continue to decline progressively and about 30 million ha of forests and wooded lands (3.7% of the 1995 area) should be lost between 1995 and 2010. The loss would be particularly significant in Continental SE Asia (10%) and Insular Asia (12%) (Table 1).
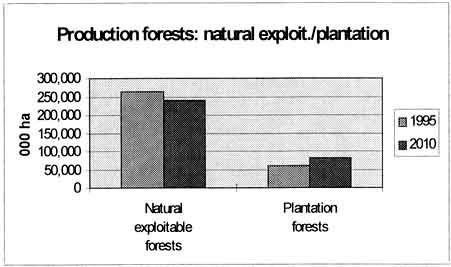
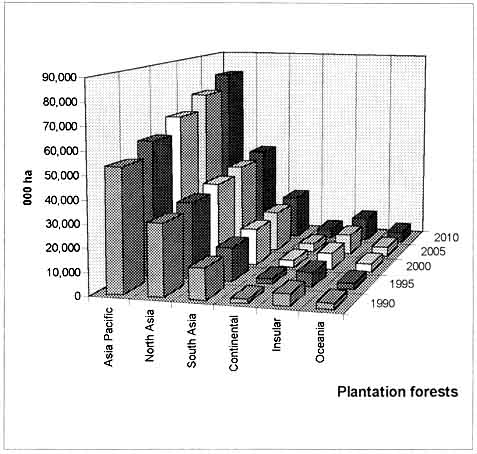
While the natural exploitable forests area would decline by 8.3% for the whole region by 2010, the plantation forests area would increase by 39% during the period considered. Plantation forests would represent in area about 24 % of the production forests (forests for industrial purposes). Expected plantation forests programmes would reach around 500,000 ha/year in North Asia, 275,000 ha/year in South Asia and Insular Asia and about 150,000 ha/year in Oceania Pacific and Continental South-East Asia.
The low productive and open forests area is expected to decrease by 6% as deforestation continues. The commercial crop area would not increase significantly during the period and its contribution to the overall regional scenario would remain relatively limited. Arable land area would increase by about 2.7% from the deforested areas.
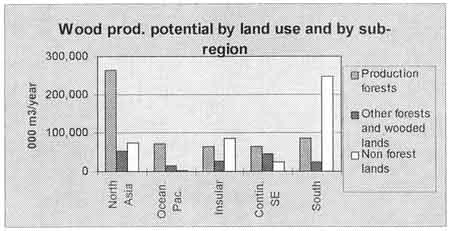
The roundwood production potential is expressed by the annual wood stock increment (SI) and is generated from the three land categories: - the production forests generate 51 % of the total SI; - the other forests and wooded lands generate 13%; - and the non forest lands 36% of the utilizable wood stock increment. Industrial roundwood production potential is issued from natural exploitable forest (42%) and from plantation forests (58%). Fuelwood and other (un-commercialised) forest products are from low productive forests and open forests 27% and from other forest lands - arable and commercial crop areas - 73%. Although the low productive and open forests cover more than 61% of the forests and wooded lands, the contribution to wood production potential is relatively limited (13%) (Figure 2).
Figure 2 - Production potential in 1995
In accordance with the hypothesis to keep constant the mean annual wood increment (MAI), the evolution of wood production potential will follow closely the changes of the land uses. Total wood stock increment (production potential - SI) in the AP region would grow by 11% during the period 1995-2010 due mainly to the increasing contribution of the plantation forests and trees growing on arable lands. The annual wood stock increment of the natural exploitable forests and low productive and open forests would decrease in proportion to the area loss and the relatively low level of MAI.
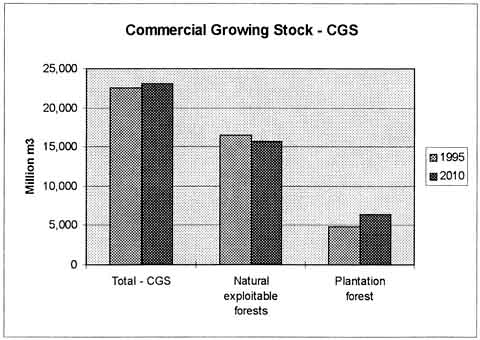
The commercial growing stock (CGS) of the natural exploitable forests would decrease by 7% but the CGS of the plantation forests would increase by 31%. Total CGS of the production forests in AP region would increase by about 2%.
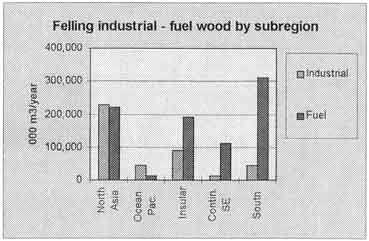
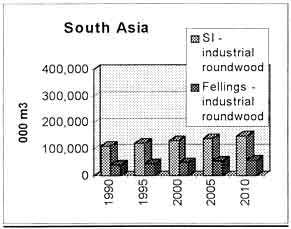
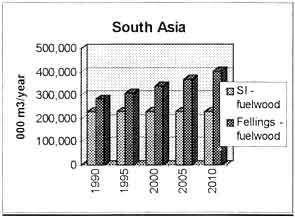
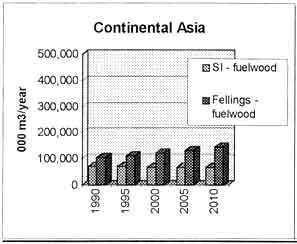
Total roundwood felling is shared between industrial roundwood felling (33%) and fuelwood felling (67%). However, the picture is quite different in the sub-regions: North Asia and Oceania Pacific subregions are felling annually more industrial wood than fuelwood; on the contrary, the other three subregions and particularly South Asia are supplying annually more fuelwood than industrial wood.
Figure 3 - Wood fellings in 1995
Fellings of industrial roundwood will increase by 23% during the period. Fuelwood fellings (which may include un-commercialised local timber) will increase by 34% and are in direct relation to the population increase. Fuelwood supply (and demand) is very sensitive to people's habits. A small change in consumption at family level could have great impact on fuelwood supply.
Arable lands have large potential for wood production particularly in South Asia countries. Continued improvement of MAI rates on arable lands could significantly increase the total roundwood production potential.
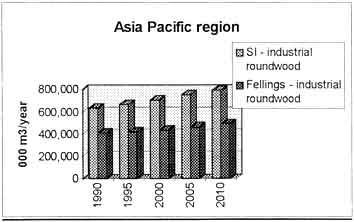
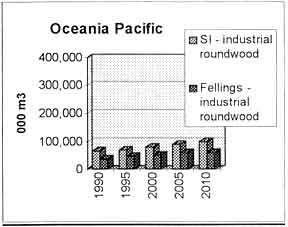
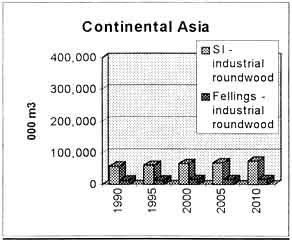
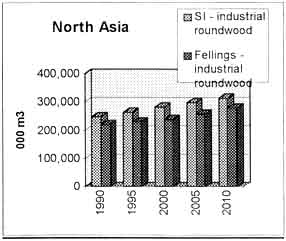
By 2010, total fellings of industrial roundwood (Figure 8) will increase by 16% but the corresponding wood production potential (SI) would increase faster (20%) showing at regional level a positive SI/felling ratio (1.5). This observation is valid for all sub-regions but is hiding divergences at country level. For example China would have a deficit in industrial roundwood supply which is covered by the excess of production potential (in industrial roundwood) of the other countries (Japan, Korea) belonging to the same sub-region.
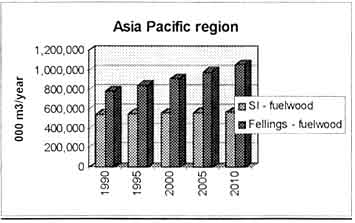
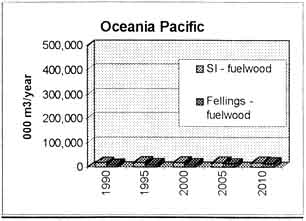
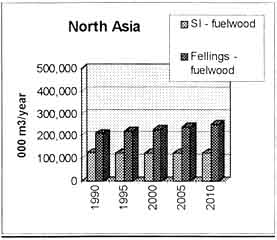
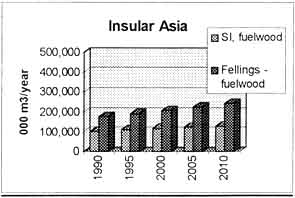
Fuelwood felling (Figure 9) for the whole AP region would be far higher than the possible potential wood increment. All sub-regions are in deficit except for Oceania and Pacific region. Although in 1995 the regional ratio SI/felling was 0.7, it is expected that this ratio would fall down to 0.58 by 2010.
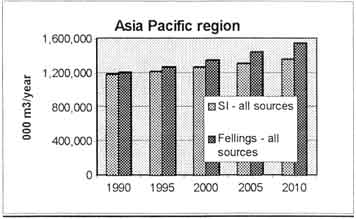
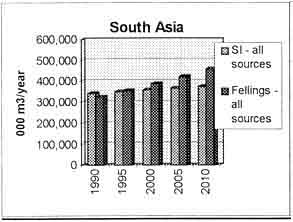
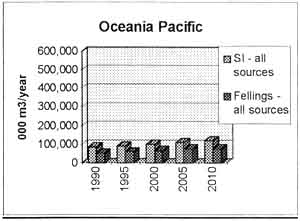
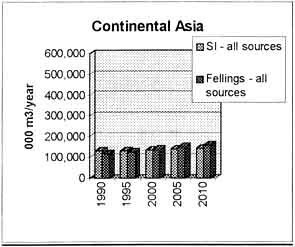
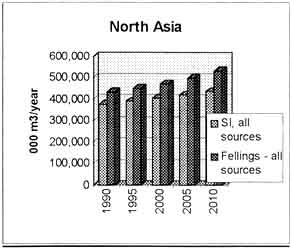
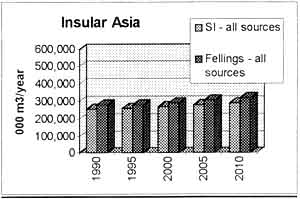
Regarding the total roundwood supply (Figure 10), the regional ratio SI/felling is going down from 0.96 (1995) down to 0,88 (2010) showing an growing deficit in total roundwood production. The gap is widening due to the rapid increase of fuelwood fellings and the population increase. The Oceania Pacific sub-region is the only one showing a positive balance SI/felling. South Asia and Continental Asia started with a positive balance in 1990 but should know a deficit situation by 2010.
Table 1.1 - Asia Pacific Region - Overall regional situation and projection to 2010
|
|
Unit |
1990 |
1995 |
2000 |
2005 |
2010 | |
|
Production forests | |||||||
|
Area total |
ha |
325,255 |
322,438 |
321,430 |
321,109 |
320,944 | |
|
|
- Natural exploitable forests |
ha |
272,046 |
262,975 |
255,092 |
247,645 |
240,604 |
|
|
- Plantation forests |
ha |
53,210 |
59,463 |
66,338 |
73,464 |
80,340 |
|
Commercial growing stock 3 |
'000 m3 |
21,473,259 |
22,478,022 |
22,640,756 |
22,863,623 |
23,118,136 | |
|
|
- Natural exploitable forests |
'000 m3 |
17,005,148 |
16,516,992 |
16,103,848 |
15,709,033 |
15,335,847 |
|
|
- Plantation forests |
'000 m3 |
4,468,111 |
4,860,811 |
5,303,757 |
5,798,451 |
6,343,398 |
|
Wood stock increment |
m3/year |
634,807 |
667,862 |
708,694 |
751,586 |
793,498 | |
|
|
- Natural exploitable forests |
m3/year |
286,168 |
275,162 |
265,748 |
256,892 |
248,552 |
|
|
- Plantation forests |
m3/year |
348,639 |
392,700 |
442,946 |
494,694 |
544,947 |
|
Fellings ind. round., total |
m3/year |
414,763 |
421,232 |
437,466 |
463,808 |
492,543 | |
|
|
- Ind. roundwood removals |
m3/year |
333,924 |
339,488 |
352,914 |
375,524 |
400,188 |
|
|
- Waste and residues |
m3/year |
80,839 |
81,744 |
84,553 |
88,284 |
92,355 |
|
Other forests and wooded lands | |||||||
|
Conservation areas |
ha |
178,207 |
278,661 |
315,418 |
316,368 |
357,598 | |
|
Low productive/open forests |
ha |
512,159 |
501,057 |
490,509 |
480,476 |
470,918 | |
|
Wood stock increment |
m3/year |
165,986 |
161,043 |
156,378 |
151,967 |
147,791 | |
|
Non forest lands | |||||||
|
Commercial tree crops |
ha |
15,493 |
15,805 |
16,550 |
16,910 |
17,338 | |
|
Arable lands |
ha |
412,199 |
418,758 |
424,447 |
429,867 |
434,841 | |
|
Wood stock increment |
m3/year |
380,952 |
391,751 |
401,305 |
410,172 |
418,771 | |
|
Fellings fuel/other wood |
m3/year |
787,018 |
846,592 |
911,159 |
981,171 |
1,057,124 | |
|
Wood stock incr., all sources |
m3/year |
1,181,745 |
1,220,657 |
1,266,377 |
1,313,725 |
1,360,061 | |
|
Fellings, all sources |
m3/year |
1,201,781 |
1,267,824 |
1,348,625 |
1,444,979 |
1,549,667 | |
|
Forests and wooded lands |
ha |
837,414 |
823,494 |
811,939 |
801,584 |
791,862 | |
|
Total AP land area |
ha |
2,843,170 |
|
|
|
| |
|
Percentage related to AP forested lands uses | |||||||
|
Forests and wooded lands |
% |
29 |
29 |
29 |
28 |
28 | |
|
|
- Production forest |
% |
11 |
11 |
11 |
11 |
11 |
|
% Natural exploit. forests |
% |
10 |
9 |
9 |
9 |
8 | |
|
% Plantation forests |
% |
2 |
2 |
2 |
3 |
3 | |
|
|
-Other forests/wooded lands |
% |
18 |
18 |
17 |
17 |
17 |
3 Commercial growing stock = for definition and calculation procedure see section 3.3.
Figure 4a - Relative importance of wood sources areas in the Asia-Pacific countries
Figure 4b - Production forests: natural exploitable forests and plantation forests areas
Figure 4c - Forested land uses: distribution by sub-region (1995)
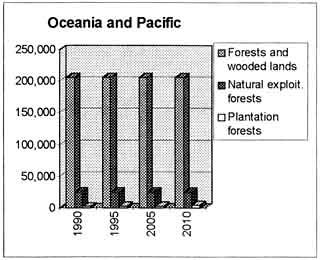
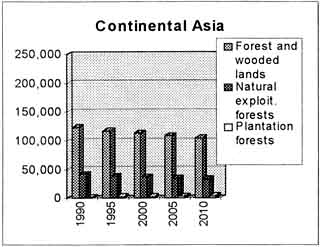
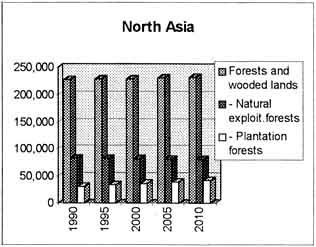
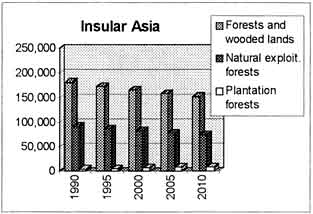
Figure 5 - Forest resources areas by sub-region (unit in 000 ha)
Figure 6 - Plantation forests - projections by sub-region
Figure 7 - Commercial Growing Stock projection, by forest type
Figure 8 - Industrial roundwood - potential (SI) and fellings
Figure 9 - Fuelwood - potential (SI) and fellings
Figure 10 - Total wood supply - potential and felling
Table I.2 - Summary of the Main Country Parameters
Table I.2 - Summary of the Main Country Parameters (Continued)
![]()
![]()
![]()