Section 3 - Storage losses and their estimation
Dry
matter loss
Standardized methods for the assessment of
losses due to insect pests in storage
Practical loss assessment method for storage
losses
TYPES OF STORAGE LOSS
Storage is but one part of the post-harvest system through which food material passes on its way from field to consumer. Losses occurring in this postharvest system, are finite and unlike growing crop losses they cannot be made up by further plant growth.
Losses occuring during storage are affected by conditions prevailing in the pre-storage stages (harvesting, threshing and drying). Similarly, poststorage losses may be affected by conditions during storage.
There have been many attempts to define the term "loss" and much confusion has arisen since "loss" has frequently been used synonymously with "damage". Loss is a measurable decrease of the foodstuff which may be quantitative or qualitative. It should not be confused with damage which generally refers to the superficial evidence of deterioration, e.g. broken grains (which may later result in loss). Loss precludes utilisation, damage inhibits utilisation.
TYPES OF LOSS
Loss may be considered in terms of either quantity or quality.
Quantitative loss is a physical loss of substance as shown by a reduction in weight or volume. It is the form of loss that can most readily be measured and valued.
Qualitative loss is more difficult to assess and is perhaps best identified through comparison with well defined standards. Nutritional loss and loss of seed are both aspects of quality losses.
1. Weight loss
Reduction in weight is obvious but it does not necessarily indicate loss. It may be due to reduced moisture content and this is recognised by a shrinkage factor. Weight loss results from the feeding of insects, rodents and birds or from spillage, due to improper handling or by the activities of pests.
Moisture changes may lead to an increase in weight and in some cases production of water by and insect infestation may partly offset the weight loss. In many instances weight loss may go undetected as the trader sells by volume. In commercial storage weight is the important factor sometimes leading to malpractices such as adulteration with water, stones, and earth to make up the deficiency. Usually some allowance is made for slight changes in moisture and also standard weight packages may be used.
2. Loss in quality
Generally quality is assessed and products graded on the basis of appearance, shape, size, etc., but smell and flavour are sometimes included. Foreign matter content and contaminants are factors in loss of quality. Foreign matter may be in the form of insect fragments, grass, rodent hairs and excrete; weed seeds, parts of plants, earth, stones, glass, etc. Contaminants that cannot be readily removed, include soluble excretions of pests, oils, pesticides, pathogenic organisms spread by rodents, and toxins arising from fungal infections.
Chemical changes may also be important, e.g. in oilseeds. Infestation in groundnuts may cause an increase in the free fatty acid level leading to rancidity in the oil, similarly in maize meal.
3. Nutritional loss
This, is the product of both the quantitative and qualitative losses. Weight loss during storage (not due to a loss of moisture) is a measure of food loss but the latter may be proportionately larger owing to selective feeding by the pests. Rodents and moth larvae may preferentially attack the germ of the grain thus removing a large percentage of the protein and vitamin content, whereas weevils feeding mainly on the endosperm will reduce the carbohydrate content. Many pests may eat the bran of cereals reducing vitamins such as thiamin. Other storage factors such as moisture and fungal infection also lead to changes in vitamin content. In beans in particular, loss of protein is very important where there is infestation, as up to 25% of the dry matter may be crude protein.
4. Loss of seed viability
This relates to loss in seed germination. Seed grain is usually more carefully stored owing to its greater potential value. Loss may be caused by changes of light, temperature, moisture, excessive respiration, infestation and, in some cases, the methods used to control infestation. Insects that selectively attack the germ will cause a greater loss in germination than others.
5. Commercial losses
Commercial losses may be a consequence of any of the foregoing factors or be the preventive or remedial actions required, as well as equipment costs. These losses are generally incurred through a lack of knowledge, experience or managerial abiIity.
a) Monetary loss
Weight loss is an economic loss as is any downgrading of produce due to poor quality. Any control measure that has to be employed to render or keep the commodity saleable can be counted as an economic loss and is perhaps the most easily accountable loss.
Losses in packaging and the costs of repacking due to rodent and handling damage, repairs and stoppages in machinery, damage to the fabric of the store are all economic losses that can be the result of infestation.
b) Loss of goodwill
This is not directly accountable but nonetheless it is very important, especially with regard to rising quality standards. A control measure that may seem uneconomic at first but leads to better custom or at least retains custom, is better than no control that leads to losing custom. This is particularly so in exports where a reputation for high quality produce is valuable to a country's economy.
c) Loss due to legal action
This may include damages awarded due to impairment of health of humans and animals, expenses incurred by third persons due to infestation traceable to a particular shipment, and various actions due to contamination.
ASSESSMENT OF STORAGE LOSSES
The extent of losses occurring after harvest and particularly during storage has been the subject of considerable speculation because of the difficulties of reaching accurate assessments of the amount being lost. It is generally accepted that assessment of storage loss is difficult, particularly in relation to the rural situation in developing countries and there is a need for assessing storage losses.
The extent of loss is important but not allimportant; other factors, economic, sociological or political, need to be considered in deciding on the methods of reducing loss. Measurement of storage loss then calls for an integrated multidisciplinary approach. Any project estimating losses should include the following essentials:
1) Clearly defined objectives
Loss measurements must be undertaken with a positive aim in view - that of loss reduction. When remedial measures have been introduced subsequent measures of loss using the same technique will enable the effectiveness of the remedial measures to be determined.
2) Reproducible methods
Methods used should be adequately recorded so that they may be used by future workers for similar types of estimation. Obvious sources of error should be noted as they occur. Techniques used should be simple and only require relatively simple and robust apparatus if this has to be used under field conditions with unskilled personnel.
3) Representativeness
This includes the choice of the area to be investigated, choice of stores within the area and the sampling of these stores. Many factors may influence the 'typical' nature of the area so there has to be a balance between the ideal and practical approach. Factors that influence storage losses inculude climate, tradition, and extension influence. For a full statistical survey of losses at the farm level, farmers should be placed in categories that influence their storage, e.g. subsistence or commercial growers, and selection of stores made randomly within these various categories. This is known as statified random sampling but there are other methods which may be of use for various situations and can be found in textbooks on sampling of populations. The danger lies in extrapolating the data recorded and using it wrongly to sometimes support preconceived ideas; so one must be aware of the inherent limitations in such data.
4) Basic framework
All loss estimations should be built up from a survey, a sampling method and the analysis of the sample to determine the loss.
4.1 Survey:
This enables one to examine the area under investigation and define any factors influencing storage so that the selection of stores accounts for these differences. Field testing of any questionnaires or sampling techniques should be done during the initial survey to remove any practical difficulties. During this stage the criteria of loss should be decided upon and once the stores have been chosen any back-ground data needed for the assessment of their losses obtained.
4.2 Sampling:
This refers to removal of grain samples from the stores. If the store is to be visited regularly, then a large sample should be taken when the grain is placed in store to provide basline data with which subsequent samples will be compared. Sampling once a month until the store is empty, coupled with records of grain consumption and disposal will enable an accurate estimate of the losses over the season to be obtained.
When such an intense sampling system cannot be undertaken, at least three samples need to be taken: 1) at the time of storage; 2) approximately halfway through; and 3) about a month before the store is emptied. These samples should be taken from the whole store to determine the pattern of infestation. Note should be made of the way in which grain is removed and of the pattern of consumption.
Sampling throughout the store causes grain to move and changes the pattern of infestation within the store so should not be used if a monthly sampling routine is operated. It is however necessary if samples are to be taken on very few occasions.
4.3 Analysis of the sample:
Testing seed grain for loss normally involves only a simple germination test using a set of sub-samples.
Analysis for quality loss is best carried out using a local grading system so that valuation of quality deterioration may be made. This will involve such points as defective and damaged grain, extraneous material, etc.
Nutritional losses need specific analysis for the particular substance one is interested in and comparison with its concentration at storage. It is important to remember that a weight to weight comparison will give misleading results as the insect damaged grain would originally have weighed more. A volume to volume comparison will be better or a comparison of a fixed number of grains taken at random. Measurement of protein using nitrogen determination will be prone to error as insects contain and produce a considerable amount of non-protein nitrogen. It is also possible that when grains are cooked whole, more nutrients may be lost from insect damaged grain than from intact grain.
Weight losses in samples removed for analysis may be estimated in several ways but prior to these it is usual to sieve off the dust and insects. These would normally be removed under field conditions prior to consumption. The proportion of these sievings can be used as a component of weight loss and for quality loss. Identification of the insects present will help the choice of possible control measures and show the relative importance of the various species.
There are three main methods of measuring weight losses caused by insects:
a) Volumetric
These may also be referred to as bushel weight or bulk density methods. They are based on obtaining an accurate standard volume of grain using simple apparatus using fixed drop heights into a standardised volume measure.
b) Gravimetric
This method only involves weighing and counting. It needs smaller samples than volumetric techniques with a maximum of about 1,000 grains and is a useful, quick, field method.
c) Indirect
These methods use some factor related to weight loss which can easily be measured and then transformed into an estimate of loss using a graph or formula. A laboratory experiment is usually done first, to determine the relationship. The results are then applied to the field samples of the same variety infested by the same pest. The most commonly used factor is percentage damaged grain as it is easily measured. Unfortunately this is complicated in the larger grain by multiple infestation leading to several emergence holes per grain and variation in the weight loss per grain. This could be avoided by using number of emergence holes per 100 grains instead of percentage damaged grain.
Losses caused by fungi
A considerable proportion of the grain rejected by the farmer is often discarded because of mould and the presence of infected grain causes a drop in quality grading. Therefore the impact of fungal infection on loss can be estimated by including the separation of mould damage from other types of damage during the analysis.
Losses caused by vertebrate pests
Vertebrates such as rodents and birds frequently remove whole grains from store so losses caused by them are often obtained by difference. Losses remaining unaccounted for are attributed to them. Some attempts to estimate losses have been made using population census and feeding trials. Both pests utilise stored food as part of their diet only so feeding trials may overestimate the consumption of stored food.
Nicasio M. Quindoza
I. INTRODUCTION
The quantity of the grain from the time of harvest until it reaches the ultimate consumers (man or domestic animals) decreases due to natural causes that can be difficult to prevent. In the warehouse, the quality and quantity of the grains received may not always be the same as that issued after several days or months of storage. Physical loss of grain in storage is the result of pest infestation (Insects, birds and rodents), microbial infection, change in moisture content, poor handling and grain respiration and microorganic/microbial consumption.
A recognition and understanding of the factors that contributes to dry matter or quantitative loss may be helpful In formulating possible preventive measures against grain losses particularly in storage.
II A. Respiration of grain and microorganisms.
Quality of the grain is usually associated with the dry matter or quantitative loss that occurs because of respiration ( Teter, 1981). Teter further noted that the actual respiration or breathing of grain itself is small. However, various organisms that live on grain are always present and respond in reasonably predictable ways to the ambient environment that consists of: 1) humidity or grain moisture, 2) temperature, 3) presence of toxins such as acids, 4) presence of microorganisms that cause deterioration such as bacteria, yeasts, and molds, and 5) physical stresses such as processing blows, heat stress, moisture stress and physical losses that reduce the quantity of materials. Moreover, the percentage of losses due to bacteria and fungi is connected to a considerable number of factors such as species of microorganisms, moisture content, temperature, aeration conditions, sanitation, degree of infestation, and duration of storage (Caliboso, 1982).
The concept of loss due to respiration has not been readily accepted in the assessment of losses in storage due to difficulty in quantification. Recently, Teter (1981) suggested that the percent dry matter can be calculated using the equation:
% DML/day = (CO2) 10-3 (0.682)
Carbon dioxide generation can be related to dry matter loss where, for each gram of CO2 given off, 0.682 gram of dry matter is lost.
For rough rice, equations developed from the laboratory and field are:
log (CO2) = 0.44 Mw - 6.08 For Mw (13.3 to 15.6%)
log (CO2) = 0.21 Mw-3.04 For Mw (10.0 to 13.2%)
log (CO2) = 2.39 sin 7 5 (Mw- B) For Mw (15.7 to 28%)
where:
CO2 = mg CO2 per 100 g dry matter per
day
Mw = % moisture, wet basis
The general equation for rough rice for the range 10 to 17% is:
log (CO2) = AMw - B
Where A and B are constants as shown in Table 1.
Seib, et al (1980) formulated the equation for dry matter loss using grain moisture content, grain temperature and relative humidity, and length of storage. The equation which is rather empirical is as follows:
DML = 1-Exp - (At) Exp D(T - 60) Exp E(W-0.14)
where:
DML = decimal value of dry matter loss
ACDE = constants
t = time elapsed, hours/1000
T = temperature, °F
W = moisture content, wet basis, decimal from The constants are:
| Palay | A | C | D | E |
| Long grain | 0.001889 | 0.7101 | 0.02740 | 31.63 |
| Medium grain | 0.000914 | 0.6540 | 0.03756 | 33.61 |
In the study on Warehouse Inventory (Philippines) conducted by NAPHIRE, the estimated loss due to respiration of rough rice and microorganisms was calculated using the formula:
LR = I ave. wt. of DM stored I I (0.68) (| 0 44 | | Mw - 11 08 |) x I storage period I
where:
DM = dry matter
Mw = average moisture content of the grain stored, wet basis
Teter (1982) summarizes the following principles that should always be considered in the estimation of dry matter loss:
B. Loss caused by insects.
Based on the capacity to infest sound kernels, insects are classified as either primary or secondary. Primary insects are those that make initial attack on fresh grain while the latter are those that feed on grain after it has been initially bored. Damage done by these insects consists of contamination and direct grain loss. Caliboso (1982) stated that a rice weevil can eat 14 milligrams during its developmental period from egg to adult.
A researcher from Tropical Products Institute recommends a "weight per unit volume method of estimating weight loss of insect infested grain."
On the other hand, researchers from CRIA Grain Processing Research Center, monitored loss and insect damage for shelled corn in four (4) different containers and formulated the equation based on the relationship between loss and insect damage.
% dry master = 1 + x(0,0085x+0.15)
Where x is % of insect damaged kernels.
In storage loss assessment, Quitco and Quindoza (1986) used the converted percentage damage method to obtain a rough indication of loss caused by insects.
L1 = I 0.5 I x I % damage x dry wt. l
where:

Example:
In a particular warehouse, 3 batches of rough rice were stored. Infestation was measured at 12% for 1st batch weighing 2,000 kg. at 14% M.C., 15% for the 2nd batch at 1,000 kg. (13.8% M.C.), and 20% for the 3rd batch weighing 2,000 kg. at 14.5% M.C., the weight loss is:
L1 = | 0.51 | x | 0.12(1,720 kg.) + 0.15(862 kg.) + 0.2(1,710 kg.)| = 677.7 kg,
C. Loss due to rodents
In Philippine storage, rodents are considered a serious pest that causes considerable amount of loss. According to Rubio (1971), the annual rodent damage was estimated at 0.8 to 4.12 cavans per ricemillwarehouse in Laguna (Philippines). In Nueva Ecija (Central Luzon), Aganon reported that the annual grain loss per warehouse due to rodent contamination and spillage was estimated at 1.92 to 2.93 cavans. Based on previous researches, the major species affecting food in Philippine storage are the Norway rat, rattus norvegicus, the common ricefield rat, Rattus rattus mindanensis, and the house mouse, Mus musculus. Benigno (1982) found that rodents weighing more than 50 grams consume 15%. Sayaboc, et al (1984) revealed that rodents have preference for whole kernels, and that rough rice constitute 95% of their diet. Considerably more grains are lost through spillage and contamination.
Caliboso and Teter (1983) suggested that to assess losses due to rodent, a constant estimate of the population density is needed. This can be obtained through trapping or by rougher methods such as counting of trails. The Zippin's (1958) method was found useful in estimating population density in the warehouse.
Based on the average body weight of Mus spe. (161 kg.), Rattus mindanensis (160 kg.), and Rattus norvegicus (330 g.), the daily intake of food constitutes 95% of the total diet. Thus, the daily loss can be computed by the formula:
LR = (Pd1 x di1) + (Pd2 x Di2) + (Pd3 x Di3)
where:
Pd1 = Population density of specie 1 (n)
Di1 = Daily intake of species (g)
For example, in a particular warehouse, there are 10 Norway rats, 3 Philippine rice-field rats, and 2 mice, the loss can be calculated as:
LR = (10 × 0.0314)+(3 × 0.0152)+(2 × 0.0025) = 0.3646 kg./day
Rodent infestations may be controlled by three general methods: biological, physical and chemical. The use of these methods (individual or combination) depends upon the prevailing storage or warehouse conditions. However, in most of the National Food Authority (NFA) warehouses, rats were controlled through good structural design of storage facilities. Warehouse floors were elevated, and windows or airvents are screened to serve as physical barriers to exclude rodents. If properly maintained, these warehouses could remain rat-proofed for many years.
D. Loss due to birds
In the Philippines, the species of bird pests which feed on crops such as rice and sorghum are known locally as "maya" or Philippine weavers. Losses caused by these birds in stored products and often observed but seldom quantified. Grain on floor due to careless handling attracts birds and regular spillage may lead to establishment of a resident population.
Initial results of NAPHIRE study indicate that stored grain weight losses attributed to birds may be calculated in the same way for rodents. A population estimate may be based on visual counts or trappings.
The mean body weight of Passer montanus, a bird species that is predominant in Philippine grain stores, is approximately 20 9. The daily intake was estimated at 30% of the mean body weight. Paddy constitutes 91 % of the total daily consumption. Thus, a single bird may consume 0.0055 kg. per day.
If estimated bird population is 150, loss is determined by:
LB = (Population Density) (Daily intake, kg.) = (150) (0.0055) = 0.825 kg./day
Several methods of controlling bird infestations in grain stores were suggested such as chemical means (poison baiting), biological methods, and physical methods. Caliboso (1982) recommends that the probable best method of bird control is to keep them off from the warehouse by bird proofing with nets or screen wire on all possible entrances like air vents and windows. Utmost care should be taken to keep the store and surrounding area clear of spillage and attractive food debris.
III. SUMMARY
The factors that contribute to dry matter loss are the respiration of the grain and microorganisms, activity of insects, and vertebrate pests such as birds and rodents.
In loss assessment, a practical and easy sampling technique in determining population density of pests is necessary in order to arrive at reasonable estimate of losses. Some of the formula that are presented can be useful tools in stock accounting and inventory control.
A warehouse with excellent sanitation should have minimal loss of dry matter. Screening to exclude vertebrate pests, integrated insect control, and microclimate control to maintain dry uniform warehouse conditions should minimize storage losses. Usually, it is only a matter of discouraging pest habitation to significantly reduce losses in warehouse.
REFERENCES
AGANON, T.M. 1981. Survey of Rat Damage in Nueva Ecija Ricemill-Warehouse. Unpublished M.S. Thesis, UP at Los Banos, 40 p.
BENIGNO, E.A.1982. Rodent Pest Control in Storage. In Grain Quality Deterioration and Losses and Grain Stock Inventory. Seminar on Efficient Grain Handling for NFA Supervisory and Executive Personnel. p. 128-153.
CALIBOSO, F.M. 1982. Birds and Pest of Grain Storage. In Grain Quality Deterioration and Losses and Grain Stock Inventory. Seminar on Efficient Grain Handling for NFA Supervisory and Executive Personnel. p. 105-127.
CALIBOSO, F.M. 1982. Insect Pest Infestation in Storage. In Grain Quality Deterioration and Losses and Grain Stock Inventory. Seminar on Efficient Grain Handling for NFA Supervisory and Executive Personnel. p. 154-192.
CALIBOSO, F.M. and N.C. TETER. 1983. Warehouse Stock Inventory and Loss Assessment. Maintaining Good Grain Quality. Proc. of the 6th Annual Workshop on Grain Post-Harvest Technology. Puncak Pass, Bogor, Indonesia. May 3-6, 1983.
QUITCO, R.T. and N.M. Quindoza. 1986. Assessment of Paddy Loss in Storage. Unpublished Terminal Report. NAPHIRE. 46 p.
RUBIO, R.R.1971. Survey of Rat Damage in Laguna Rice Mill-Warehouses. Unpublished Undergraduate Thesis. UP at Los Banos.
SEIB, P.A., PFOST, A SUKABDI, V.G. RAO and R. BURROUGHS. 1980. Spoilage of Rough Rice Measured by Evolution of Carbon Dioxide. Proceedings of Grain Post-Harvest Workshop. Kuala Lumpur, Malaysia. p. 75-94.
TETER, N.C.1981. Grain Storage. SEARCA College, Laguna, Philippines. 86 p.
TETER, N.C.1982. Dry Matter Loss. In Grain Quyality Deterioration and Losses and Grain Stock Inventory. Seminar on Efficient Grain Handiing for NFA Supervisory and Executive Personnel. p. 60-89.
ZIPPIN, C.1958. The Removal of Population Estimation. J. Wild. Man 22 (1): 82-90
Table Rate of deterioration constants for some cereal grains (To compute CO2 generation).
| GRAIN | MOISTURE RANGE, Mw |
CONSTANT A |
CONSTANT B |
| Corn,yellow dent | 10.0-13.2% | 0.17 | 2.00 |
| 13.3-17.0% | 0.27 | 3.33 | |
| Sorghum | 10.0-13.2% | 0.125 | 1.65 |
| 13.3-17.0% | 0.32 | 4.19 | |
| Rough rice | 10.0-13.2% | 0.21 | 3.04 |
| 14.2-17.0% | 0.44 | 6.08 | |
| Polished rice | 10-14.1% | 0.16 | 2.83 |
| 14.2-17.0% | 0.49 | 7.48 | |
| Brown rice | 10.0-13.7% | 0.17 | 2.67 |
| 13.8-17.0 % | 0.44 | 6.41 | |
| Wheat, soft | 14.1-17.0% | 0.36 | 5.15 |
APPENDIX I. DETERMINATION OF PERCENTAGE INSECT DAMAGE GRAIN.
Procedures
A random sample of 100-1000 grains is taken and the number of bored grains is counted. This should be done immediately or within a few days after sampling.
The percentage of damaged grains is calculated with the following formula.

This percentage is converted into a percent weight loss by dividing it by the conversion factor or multiplying it by 1/c.
The following conversion factors have been established in practice where the larvae stages develop within the grain, e.g. Sitophilus spp., Sitotroga carealella:
| Corn (stored as shelled corn or as ears without husks) | % bored grains x 1/8 or 1/3 |
| Corn (stored as ears with husks) | % bored grains x 2/9 |
| Sorghum | % bored grains x 1/4 |
| Paddy | % bored grains x 1/2 |
| Rice | % bored grains x 1/2 |
APPENDIX II. POPULATION ESTIMATION FROM REMOVAL DATA CALCULATION BY MULTINOMINAL METHOD SUMMARIZED FROM ZIPPIN, 1985
1. Calculate total catch:
T = ![]() = Y1
+ Y2...YK
= Y1
+ Y2...YK
2. Calculate:
 = Y2
+ 2Y3 + ... (K - L) YK
= Y2
+ 2Y3 + ... (K - L) YK
3. Determine the ratio:
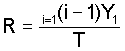
4. Determine (1 + qk) from the graphs:
5. Determine N. the estimated population:
Figure Graphs for estimation of (1 - qkX from the ratio R. (Zippin, 1958).
Source: Biotrop Special Publication No. 12, 1980