![]()
![]()
![]()
A tool in vegetation and land-use surveys
Specifications of aerial photographs
Use of aerial photographs in surveys
Advantages and limitations
Use in forest inventories
Information provided by aerial photographs
Correlation of information
Determination of volume
Combined aerial-ground techniques
Use of aerial photographs in inventory
BY STEPHEN H. SPURR
This article describes and evaluates the use of aerial photographs in the field of forestry, particularly in making vegetation and land-use surveys and in making forest inventories. This recent and ever-developing technique, when properly co-ordinated with ground work, offers great opportunities for speeding up and putting on a uniform basis the knowledge of the forests of the world that is now much needed.
For all students of the land, there is a continuing need for new tools and techniques by which the condition of the land, its vegetation, and its culture can better be understood and evaluated. The aerial photograph is perhaps the most important of these to be adapted for this purpose in recent years. Aerial photographs have been used in the mapping of vegetation since 1920, but their development as a major tool in forestry and related fields has come about in the United States since 1940. Modern techniques involving the use of aerial photographs have been made possible by the availability of high-grade photographs at a low cost, coupled with the development of simple photogrammetric instruments, and of photo-mensurational techniques. Wherever knowledge concerning land forms, vegetation, and land use is required, the aerial photograph is fast becoming essential.
The principal advantage of aerial photographs in vegetation and land-use surveys lies in the fact that they provide a permanent record of conditions which is available in the office for detailed analysis. When studied with the aid of the stereoscope, they present a three-dimensional picture of the terrain seen from directly above. Species may be identified and their images measured with a surprising degree of accuracy. Maps can quickly and accurately be prepared from photographs. Units of vegetation and of land use can be delineated from the photographs and their areas determined with greater accuracy than is possible in the field in any reasonable amount of time.
In using aerial photographs, as with using any other tool, the first concern must be to select a tool of high quality, tailored to fit individual needs. Only by so doing will the photographer possess a tool of the greatest possible usefulness.
Aerial photographs are of many types, but those commonly used meet a fairly standardized set of specifications. They are generally 23 cm. (9 in.) square and are taken with the camera pointed vertically from an airplane flying parallel strips in a cardinal direction. Successive photographs in each strip are taken so that each photograph covers 60 percent of the area covered by the previous exposure. This endlap is necessary for stereoscopic vision and for photographic triangulation. Adjoining strips generally overlap on the edges (sidelap) about 30 percent.
To be satisfactory for mapping and accurate photo-interpretation, the photographs must be taken with a minimum of tilt (less than 3 degrees) by a trained crew using a precision aerial camera.
Oblique photographs are useful for illustrative purposes but, in comparison with vertical photos, are of relatively little value in forestry work. Enlargements are excellent for office records, but are less satisfactory than contact prints in the field and in stereoscopic study. Mosaics - several photographs pieced together in either an accurate (controlled) or an approximate (uncontrolled) manner provide a useful substitute, but cannot be studied three-dimensionally.
Of the many specifications concerning aerial photographs other than those that are fairly well standardized, the most important in vegetation and land-use surveys are probably: (1) date, (2) scale, (3) focal length of camera, (4) season, (5) time of day, and (6) film and filter combination utilized.
First of all, the photographer must obtain photographs of recent vintage. Photographs taken ten years ago picture the land as it was ten years ago, and it is surprising to see how many changes occur in the landscape over such a short period. In some sections of the United States, it is almost impossible to correlate present day landscape with the image of the landscape as it was a decade before.
The scale of aerial photographs, too, is highly important. Scale is a function of the altitude of the photographic plane and the focal length of the aerial camera, as expressed by the formula: RF = f/H, where RF is the scale expressed as a natural ratio or representative fraction, f is the focal length of the camera in feet and H is the height of the plane above the ground in feet. For instance, if a plane flying 2,514 m. (8,250 ft.) above the ground takes a picture with a camera having a lens of 0.21, cm. (8¼ in. = 0.6875 ft.), the scale is 1:12,000, or 1,000 ft. to the inch.
Since the height of the plane above the ground varies constantly in hilly country, a photograph has as many different scales as the ground has different elevations. Consequently, the scale given for a photograph generally refers to the scale at an average ground elevation or to the scale at the center of the photograph. At the higher elevations, the height of the plane above the ground is less, and the scale of the photograph larger; at the lower elevations, the scale is smaller.
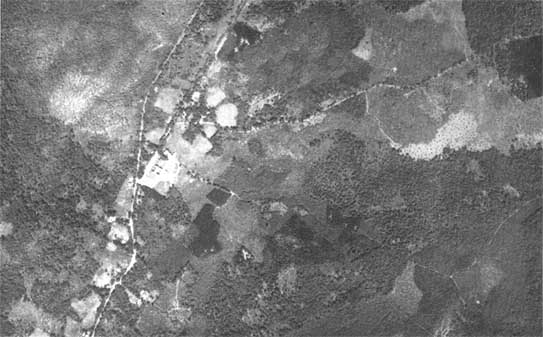
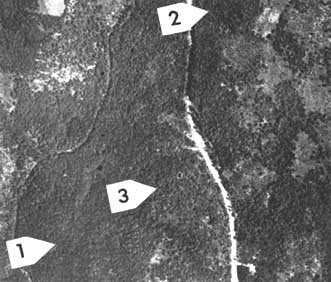
Figure 2. Harvard Forest. Scale 1:12,000. Area covered 2,000 acres (800 ha.).
The standard U. S. Department of Agriculture photograph at the scale of 1:20,000, or 1,667 ft. to the inch, provides a general idea of the entire landscape but is of limited value in the detailed study of a portion of the terrain. Photographs taken for the U. S. Geological Survey are on an even smaller scale and can be used only with difficulty in land-use studies. At the other extreme, photographs taken at a very large scale such as 1:4,800, or 400 ft. to the inch, rob the observer of the perspective so valuable in aerial study. Furthermore, the number of photographs to be handled increases as the square of the scale. For instance, sixteen times as many photographs are needed to cover an area at 1:5,000 as at 1:20,000. Since the cost of mapping varies approximately with the number of photographs that must be handled, the cost of a land-use study at 1:5,000 should be about sixteen times as expensive as one carried out at a scale of 1:20,000. Taking into consideration the cost of photography, the number of photographs required, and requirements for visibility, the ideal scale for land-use purposes seems to be somewhere between 1:12,000 and 1:15,840 or between 1,000 ft. to the inch and 1,320 ft. to the inch. Within this range, the photographs are at a sufficiently large scale that the individual trees and shrubs can be clearly seen and studied, and yet at a sufficiently small scale that each photograph covers about 1,000 ha. (4 sq. mi.) and the cost of photography is not exorbitant.
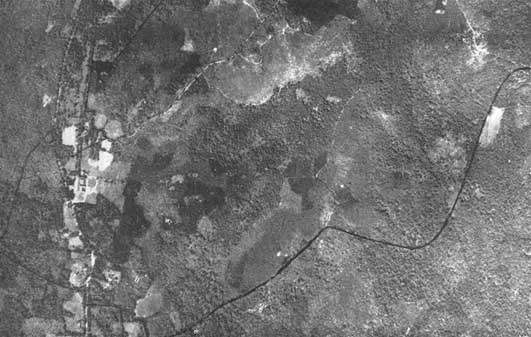
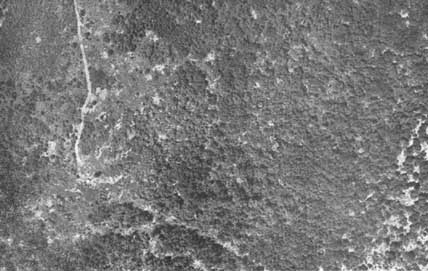
The effect of scale upon the appearance and usability- of aerial photographs may be illustrated by four photographs of the Harvard Forest Headquarters and the Prospect Hill Tract of the Forest in Petersham, Massachusetts. Figure 1, at a scale of 1:18,000 or 1,500 ft. to the inch, covers an area of approximately 1,700 ha. (4,200 acres). The thousand-acre parcel of the Harvard Forest is centered in the one photograph, but the individual stands are too small for detailed study. In this and the two succeeding photographs, the small clearly square dark stand immediately east of the Headquarters buildings is a red pine plantation almost exactly one acre in area.
The second photograph (Figure 2) is at a scale of 1:12,000 or 1,000 ft. to the inch. About 800 ha. (2,000 acres) are covered, or only about one half the area covered in Figure 1. It will be noted, though, that the coverage is sufficiently great to provide a good idea of the countryside, and that the detail is sufficiently good that much information can be gleaned from a stereoscopic study under magnification of the original nine-inch-square contact print.
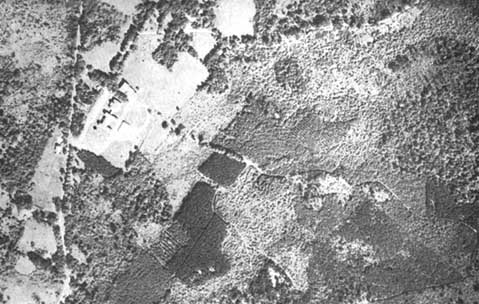
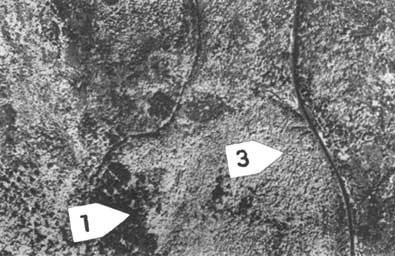
Figure 3 has a scale of 1:600, or 500 ft. per inch. Covering less than 200 ha. (500 acres), it provides great detail, but only a limited idea of surrounding terrain. While yielding much information, extended coverage at such a large scale would be exorbitant and would necessitate the handling of excessive numbers of photographs.
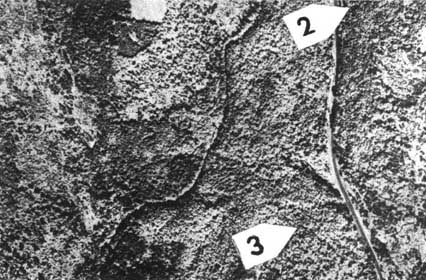
Finally, a small portion of the east-central part of Figure 1 is portrayed at a scale of 1:300, or 250 ft. per inch in Figure 4. Barely sufficient detail is pictured in the slightly more than 40 ha. (100 acres) covered to locate the area. Perspective and continuity are both lost. Here is a case of not being able to see the forest for the trees. Such a large scale has little use in normal studies of vegetation and land use.
Most commercial aerial photography is done between 1,500 and 4,900 m. (5,000 and 16,000 ft.), because the air is too rough beneath that zone and oxygen apparatus is required above it. Consequently, once the scale of photography is chosen, choice of the focal length of the camera is limited. Most forestry photography is done with cameras having a focal length of 15 cm. (6 in.), 21 cm. (8¼ in.), and 30 cm. (12 in.). The shorter the focal length at a given scale of photography, the lower the plane will fly and the greater will be the displacement of images in the photograph. Great displacement is desirable in flat country because it accentuates the height of the trees in the stereoscopic image, but it is undesirable in rough country because topographic features are displaced and the photograph becomes highly distorted.
The season of year, also, is highly important. Photographs taken in the spring and fall may portray the various species in contrasting tones. Good photographs in these seasons, however, are very difficult to obtain, because the weather is suitable for aerial photography on only a very few days in any one month, and the chances of being able to photograph the vegetation at just the right stage of coloration are rather slight in any one season. Furthermore, the tone in which the vegetation registers may well vary from the north to the south end of the strip, from low to high elevations, and from frost pockets to ridge top. Consequently, spring and fall photography are seldom resorted to in large photographic surveys. Winter photography, too, has serious drawbacks to anyone interested in vegetation. When the foliage is off deciduous plants, no part of the plant is large enough to resolve in average-scale photographs and, consequently, areas of deciduous vegetation appear open and slightly out of focus on winter photographs. For the engineer, of course, winter photographs have many advantages, because without the deciduous vegetation much more can be learned about the ground beneath; but for the forester, the botanist, and anyone else interested in vegetation, principal reliance must be placed upon summer photography, when the foliage is in normal green coloration. Particularly iii mountainous country is it important that photographs be taken during the middle hours of the day, so that massive shadows may be avoided. Such shadows often obscure detail and make complete interpretation of the prints difficult or impossible.
Assuming that summer photographs are required, the type of film and filter utilized will have an important bearing upon the value of the photographs for land-use studies. Photographs taken on panchromatic film will be excellent in detail but are apt to portray vegetation in such a uniform tone that distinctions between species, sites, and other important details are apt to be lost. Photographs taken on infrared film with visible light excluded by means of a deep red filter register the conifers in dark tones and the hardwoods in light tones. On them, many species can be recognized. The photographs are apt to be made up of intense blacks and whites and to have so much contrast that the detail is poor. Furthermore, shadows register in true blacks and may be very annoying. The most useful type of photograph for land-use purposes currently known is the modified infrared. i.e.. a photograph taken on infrared film by the means of a light-colored filter which allows the visible as well as the infrared light to pass through the lens. Such a photograph is a compromise between the normal panchromatic and normal infrared photographs, and it combines much of the good detail of the panchromatic with much of the good tone variation of the infrared.
Figure 3. Harvard Forest. Scale 1:6,000. Area covered 500 acres (200 ha.).
The appearance of these standard types of black and white photography is illustrated by three photographs taken during the summer of a portion of the Harvard Forest in central Massachusetts. All were taken at a scale of 1:12,000. In Figure 5, the panchromatic photograph, the detail is clearly defined and the distinctions between open and forested land readily apparent. Variations in composition within the forest, however, are hardly evidenced. The normal infrared photograph, Figure 6, sharply differentiates between the black of the white pine stands, the medium gray of the hemlock, and the light tones of the hardwood. The open land is much less apparent, and a stereoscopic examination would reveal a slight fuzziness in detail throughout, due to the excessive contrast of the print. The modified infrared photograph, Figure 7, looks more like the panchromatic, and indeed has the good detail and normal appearance of that type but maintains most of the tone variations between species which are so excessively brought out in the normal infrared. The modified infrared is a compromise and one well suited to widespread use.
Figure 8, a map of the area shown in Figures 5, 6, and 7, is included to illustrated the manner in which different forest types can be mapped from aerial photographs. The code letters indicate the individual species and the height and density of each stand. WP, for example, indicates white pine, T is hemlock, RO is red oak, RM red maple, PB paper birch, etc. The numbers show the average height of the trees in 10-foot classes. Hence WP-9 means white pine between 80 and 90 feet high. The final letters indicate stand density, A being the most dense and D the least dense.
Color photography has not yet advanced to the point where good color photographs can be consistently taken. Even the best color photographs taken today have poorer resolution of detail and less variation in tone within the grains than the average panchromatic and infrared photographs.
To sum up present-day knowledge as to the proper specifications for photographs to be used in land-use studies, it would appear that vertical aerial photographs of recent vintage, taken during the period of normal coloration of the foliage by the modified infrared technique, are required. Probably, a scale of 1:12,000 and 1:18,000 (between 1,000 and 1,500 ft. to the inch) is desirable.
Photographs of the proper specifications can be used in two general ways. First, by photogrammetric methods, maps may be constructed showing the distribution of physiographic units, vegetation, and land-use types, and our natural units may be classified to almost any desirable degree. Secondly, through photo-interpretation, the photographs may be studied under a stereoscope and thus is seen in three-dimensional miniature a bird 'e-eye view of the terrain, complete with infinite detail of vegetational and land-use patterns.
The problem of surveying and map-making from photographs is complicated by the fact that the aerial photograph is not a map. It is rather a picture distorted among other causes by: (1) topographic displacement, (2) tilt of the airplane and the camera at the moment of photography, and (3) film and paper shrinkage. Mountain tops, for instance, will be registered on aerial photographs farther away from the center of the photograph than they actually are. Conversely, valleys will register closer to the center. In a photograph of an average scale of 1:16,000 or 4 in. to the mile taken over an area of moderate relief in central New York, for instance, the image of many objects around the edge of the photographs will be displaced 0.6 cm. (1/4 in.), representing more than 90 m. (300 ft.) on the ground.
If the photographs are truly vertical, or within one or two degrees of being vertical, however, all displacement will be radial from the center, that is, a radial line drawn from the center or principal point of the photograph through the image of the object will somewhere pass through the true location of that object. The true location of an object, therefore, cannot be determined on a single photograph but can be found by triangulation from the centers of two or more photographs on which the image of that object can be seen.
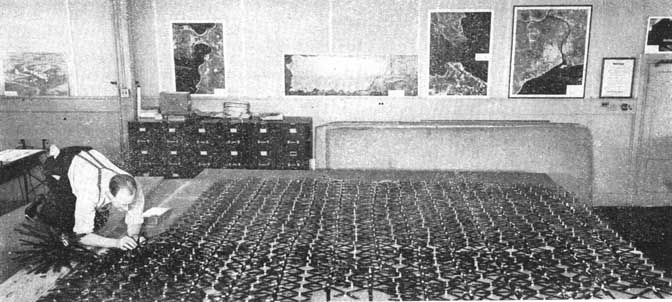
A great majority of the small scale maps (1:10,000 or smaller) constructed today are made from aerial photographs by means of techniques based upon this radial line principle. Provided that a series of points visible on the aerial photographs are carefully located by ground surveying, the position of a series of points on each and every photograph can be rapidly plotted by radial line triangulation. A large triangulation network, constructed with a separate mechanical temples for each photograph, is illustrated in Figure 9. The procedure is analogous to conventional plane-table triangulation, each photographic center being a triangulation station.
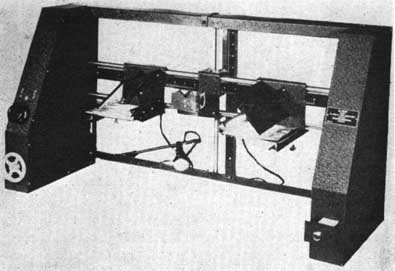
Once a radial line control network has been established, it then remains to transfer detail from photographs to the map established by this network of points. A wide variety of transfer devices exists, but only the less expensive and the simpler types can be feasibly utilized by the average user of photographs. Such a transfer device is the reflecting projector, which looks and operates much like a photographic enlarger, and by which the photographic image can be projected onto the radial line network of points. Devices utilizing the semitransparent mirror, too, can be used. Various types of camera lucida are on the market, of which the Rectoplanigraph is one of the more recent versions (Figure 10). With these, the image of a single photograph can be superimposed on the radial line network and photographic detail can be traced directly. Another, the Multiscope, is a combination of the mirror stereoscope and the camera lucida in a highly flexible form (Figure 11). With it, the stereoscopic image rather than the single photograph can be superimposed upon a radial line net or map of a widely different scale. With these and with several other instruments, it is possible to transfer detail from the photographs to the map, correcting in the process the distortions and the displacements of the photograph. Thus, a reasonably accurate map can be constructed from the photographs for only a few dollars per square mile. Only a minimum amount of terrestrial surveying is necessary and only a few days are needed to make a detailed map of an area showing the distribution of vegetation and land-use types.
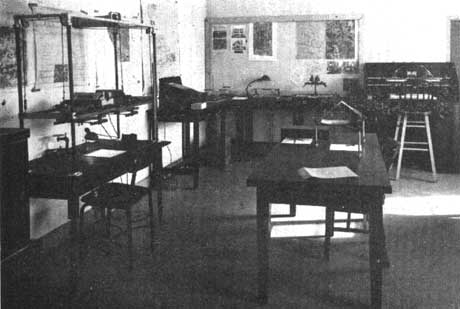
If a topographic map is desired, simple contouring devices are available. A view of a laboratory designed for the use of aerial photographs in forestry and land-use studies is given in Figure 12. In this room at the Harvard Forest are developmental models of the Multiscope, a camera lucida of the Sketchmaster type on the central table, mirror and lens stereoscopes on the tables along the wall, and a fluorescent light table at the right.
A great and obvious value of aerial photographs in land study is in the mapping of vegetation. The size, shape, and character of homogeneous vegetation and land-use units is quickly apparent under the stereoscope. Unit boundaries can be accurately seen and transferred to a base map. With an instrument such as the Multiscope, which was developed specifically for forest mapping, the stereoscopic image can be superimposed upon a base map of the same-or different scale, and a map of a complete stand turned out in a single operation. From 1,200 to 12,000 ha. (3,000 to 30,000 acres) can be classified into forest stands per man day. The amount of checking necessary in the field will be determined by the quality of the photographs available, the skill of the interpreter and mapper (two-man crews are generally used), and the map classification system used.
The map classification system will greatly affect the speed of the photographic mapping of stands in forestry and related fields, the amount of field checking required, and the value of the map in controlling subsequent inventory work. The most desirable classification in forestry is one based upon the variables which can be recognized and accurately determined on aerial photographs - that is, a system in which the variables are selected from type, stand density, tree height, crown diameter, and topographic site. Conversely, the least desirable systems are those based upon variables not recognizable on aerial photographs - such as merchantability, stem diameter, and site-class, variables which require extensive field checking for accurate determination.
The choice of the classification system will depend upon the purpose of the inventory, the forest area involved, and the quality and specifications of available photographs! For most projects, however, a three-part code classification, indicating (1) species, (2) height, and (3) density, seems to be basic. For instance, P5A would indicate a pine stand, 13 to 17 m. (45 to 55 ft. high), and more than 85 percent stocked. Through combination, practically any forest stand can be accurately characterized. In certain regions, and under certain conditions, it may be advisable to add or substitute a code for crown diameter or one for topographic site.
So much for aerial surveying techniques. Possibly of greater use in land-use and land-use planning studies is the information which can be obtained by the stereoscopic study of the photographs without recourse to mapping techniques.
The art of recognizing features in aerial photographs is a highly skilled one. Particularly on vertical photographs, familiar objects may not be recognized because of the unfamiliar vantage point. Considerable information can be gleaned from single photographs by observing the horizontal size and shape of objects, shadows, tone, and relative arrangement. Much more information can be obtained from the three-dimensional stereoscopic image. As a result, all photo-interpretation, both in the office and in the field, should be done with the aid of the stereoscope.
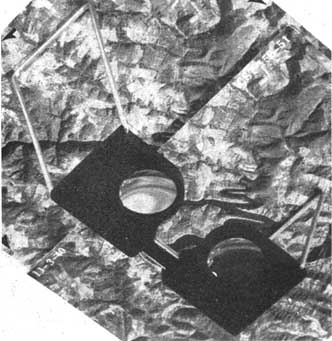
For most purposes, a simple lens type stereoscope (Figure 13) is preferable, as it is portable, is easy to use, and provides adequate magnification. Mirror stereoscopes, of which the Multiscope represents a more complex type, permit the entire stereoscopic overlap to be studied at one time but are expensive and reduce the scale of the image. In using stereoscopes, care should be taken to align the photographs carefully along the line of flight. The procedure, detailed in most works on photogrammetry, provides the best possible stereoscopic image and eliminates eyestrain.
The main guides to object recognition on aerial photographs are the pictorial elements of shape, dimension, tone, texture, and shadow pattern. Occasionally a single one of these pictorial elements will serve to identify an object but more often several elements must be taken into consideration.
For example, consider that there is a dark area on an infrared photograph. From the dark smooth texture, it is evident that it is water. Irregularities on the surface, however, caused by objects of lighter tone and tall enough to throw a shadow, would further indicate that this is not a lake but a swamp containing vegetation of at least some height. Such is the approach in photo-interpretation. Again, suppose that one wishes to identify a tree. From its dark tone one might guess that it was a conifer. From the shape of its shadow and from the site where it grows, it might be further identified as a pine. From the peculiar star-shaped appearance of the tree when viewed from above in the stereoscopic image, an appearance caused by its layered branches, the tree could be positively identified as a white pine.
The recognition of site and the identification of species will illustrate both the advantages and limitations of aerial photographs. Forest site quality, the capacity of an area to produce tree growth, is basically a function of soil, topography, and local climate. Classifications of site such as are made on the ground in terms of indicator plants, growth rate, or the height that the average dominant tree will reach at a given age, can obviously not be made from aerial photographs. On the photographs, however, the photo-interpreter can evaluate the topographic location of an area, can frequently obtain some idea of the soil and underlying geologic formations, can recognize many of the tree species, and can estimate the ratio of tree height to crown diameter. From a synthesis of all these factors, he should be able to make a reasonably accurate diagnosis of the site. For instance, a level terrace in central New England, located in a river valley but definitely above the elevation of the water, with a light-colored soil indicating sand and an even texture indicating the absence of rock, and covered with a scattered growth of a pine reaching only into the middle-sized classes, would be readily identified as a pitch pine-white pine barren. Such an identification has a definite site connotation.
In identifying species of plants, one thinks at once of tree species, although it is possible to identify many shrubs, particularly where the shrubs occur in definite strata, as those in transition zones from deep swamp to dry land. During the period that aerial photographs of woodlands have been taken, it has been observed that many tree species and groups of tree species could be recognized from stereoscopic examination. The method of recognition is based in part upon a study of the pictorial elements of tone, texture, shadow pattern, shape, and dimension mentioned above. In large part, however, the problem of species identification is an ecological one. Unless the interpreter has an intimate knowledge of the groupings of species in relation to topography and site, he can make only limited identifications. In other words, he must have a thorough knowledge of the ecological relations of the forests in the specific region being studied.
Species identification from aerial photographs, then, is by no means simple. Few hard and fast rules can be laid down. Considerable training and experience are required. Yet, with this training and experience, much can be accomplished. If, for instance, the distribution of tree species in an area is clearly correlated with topography and site, a separation of softwoods and hardwoods alone on the aerial photographs, on the basis of tone together with the mapping of site quality, may suffice to give a clear picture of the distribution of species groups.
In New England, for example, most of the coniferous species can be recognized on modified infrared photographs taken during the summer season. Spruce registers in a darker tone than balsam fir, and the fir in a darker tone than the pines. Hemlock is still lighter, and tamarack is lightest of the conifers. Characteristic differences in shape, too, can be recognized. White spruce should never be confused with white pine because of the characteristic conical shape of the spruce crowns, even though the two species photograph in similar tones. The feathery, fine appearance of tamarack is quite distinctive from that of the other swamp species with which it grows. If the interpreter knows what species may be expected on a given habitat, he can usually obtain enough information from the tone, shadow pattern, and shape of the crown for a fairly specific identification. The problem of differentiating the hardwood, however, is much more difficult. Variations in the tones of hardwoods may be noted, but they are apt to be inconsistent and hard to tie down. Except where we can rely upon ecological rules, as for instance in identifying red maple in a characteristic red maple swamp, we can seldom make specific identifications of individual hardwood species.
Photographs are still a new and relatively untried tool in vegetation and land-use surveys. They constitute a permanent record, easily filed and readily obtainable, of the status of the land at the moment of photography. They contain a wealth of information not capable of being reduced to a map, words, or any other form of record. Whether detailed maps are to be prepared, or whether the photographs are to be used solely as a source of factual information gleaned through photo-interpretation, the photograph as a tool in vegetation and land-use surveys seems destined to become more and more useful and more and more generally used.
Figure 8. Forest-type map of area photographed in Figures 5, 6, and 7. This map and the area photographs courtesy The Ronald Press Co Aerial Photographs in Forestry, by Stephen H. Spurr; copyright 1948.
NOT only can aerial photographs, properly used, be valuable in improving knowledge of forest types, land conditions, etc., but much forest inventory information can be obtained as well. The following section of the paper deals with this particular problem.
Timber cruising is an indispensable but arduous part of the forester's job. By making the proper use of aerial photographic techniques, the amount of field work necessary in timber cruising can be greatly reduced, and accurate volumetric estimates may be prepared in a minimum of time and at a moderate cost. Ordinarily, the question is not whether aerial or ground techniques are preferable. Rather, the problem is how best to combine the two approaches so that they -will complement each other.
In considering forest inventory, one normally thinks of volumetric and growth estimates. In much forest management, however, it is not timber volume that is primarily desired, but instead the acreage of each forest condition and of each site quality. Wherever acreage values are desired, the value of aerial photographs in supplying them is unquestioned. On the aerial photographs, stands can be classified by composition, density, and height. Stand maps can quickly and accurately be prepared, and the acreage of each condition class or other unit can be determined far more accurately and quickly from aerial photographs than from ground techniques.
It is when volume and diameter values are desired that the problem of how best to use aerial photographs becomes complicated. Obviously, much necessary information cannot be obtained directly from aerial photographs. For instance, the diameter of the stem cannot be seen, nor can the number of merchantable logs be counted. Information on the form of the stems, the amount of cull, and the rate of growth also cannot be obtained from aerial photographs.
Actually, the amount of information regarding forest trees that may be obtained from normal-scale aerial photographs is strictly limited. Only six important variables characterizing the individual trees and stands can be determined or measured on even high quality pictures. First, many tree species, especially softwoods, may be identified in aerial photographs of the proper specifications. It should be noted, however, that many distinctions can be made only on the ground. Second, site quality can be classified on aerial photographs in terms of topographic location or species composition but not in direct terms of productive capacity of the soil. Third, tree heights may be measured. Fourth, crown diameters may be determined. Fifth, the percentage of growth stocking may be estimated in terms of crown closure. Finally, the number of dominant and co-dominant crowns in a given area may be counted.
In using aerial photographs in volumetric estimates, therefore, it must be known how precisely each of the above six variables may be evaluated. Then, it must be determined to what extent these variables are correlated with tree volume and tree diameter. Only then will one be in a position to know how much volumetric data can be obtained from the photographs and how much must be left for field determination. When this is known, it should be possible to design a timber cruise combining in the most effective fashion photographic analysis and measurements made on the ground.
First, let us consider the accuracy of measurements made on the photographs. Of the six variables listed above, two of them - species and site - are not numerical in nature. Many individual species, especially softwoods, can be identified on aerial photographs of the proper specifications. Many others, however, can only be lumped together in groups of species. Still others, especially many of the hardwoods, can seldom be positively identified. Obviously one can determine the volume on aerial photographs only of those species which can be recognized on the photographs. Thus, it might be possible to determine the volume of white pine in an area from photographic analysis only, but it would not be possible to list the volume of red oak as distinct from that of other oaks and hardwoods which have a similar appearance on the aerial photographs.
Broad site types can be delineated provided they can be classified in terms of topographic and moisture distinctions which are recognizable on aerial photographs. Topographic location may be listed as bottom, low-slope, mid-slope, high-slope, or top. In regard to moisture, the site can be said to be wet, moist. medium dry, or very dry. Absolute elevation - the number of feet above sea level - can be estimated or even measured. Aspect - whether an area faces north, south, east, or west - can also be determined, as can the percentage of slope or grade. From such a classification, site quality can be determined on the photograph with considerable precision. It cannot be determined, however, in terms of site index, or indicator site-type.
Of the four variables concerning forest trees and stands that can be measured mathematically on aerial photographs, tree heights have attracted the most interest. The height of a tree on the photograph can be determined by three general methods. First, the displacement of the tree image in the single photograph can be measured and converted to tree height. Along the outer margins of the photograph, the tip of the tree will be displaced outward from the center more than the base and the tree will appear to be lying down, from which condition the actual displacement may be measured. The amount of displacement, though, is so small that the practical application of this method is limited to photographs taken with a wide-angle lens at a relatively low altitude and to conical trees, such as spruce and balsam fir, where both the tip and base of the tree can be seen and identified precisely on the displaced image.
If the angle of the sun at the time the photograph was taken is known and the length of the shadow can be measured, the height of the tree can easily be calculated. The shadow method has been extensively used in Canada for nearly 20 years and is rapid once the angle of the sun has been' calculated. However, it is subject to a number of limitations. It will yield accurate tree height measurements without adjustment only when a shadow long enough to be measured falls upon an unobstructed level piece of ground. Errors are frequently introduced by the slope of the ground, by foliage or snow on the ground, and by the fact that only trees growing next to clearings can be measured by this method.
Of the three methods of height determination, the most accurate and the most satisfactory when it has once been mastered is the method of parallax differences. Basically, this is a method of measuring the apparent height of the tree as it appears in the stereoscopic image. With the aid of a parallax wedge or other parallax measuring device, a floating mark is placed in the stereoscopic image so that it appears to have the same position in the third dimension as the base of the tree. A reading is then taken. The floating mark is then raised so that it appears to have the same elevation in space as the top of the tree. Another reading is then taken and the difference between the two readings can be converted quickly into the height of the tree. With this method, the height of any tree on a high quality photograph of average scale, as 1:15,840, can be determined within about 1.5 m. (5 ft.). Ordinarily, the average error will be markedly less. When the heights of a number of trees are averaged, parallax measurements made on the aerial photographs frequently differ by less than 30 cm. (1 ft.) from measurements of tree heights made on the ground. The chief disadvantage of the parallax method is that it requires more training and much more experience than the shadow method. Once mastered, however, it will ordinarily be used almost to the exclusion of other methods.
Much more readily measured on the aerial photograph is the crown diameter. By the use of a micrometer wedge, or any other precise device for measuring horizontal distances on the aerial photographs, measurements of crown diameter can quickly and accurately be made. The experienced photo-interpreter should have no difficulty in classifying crowns into 0.9 m. (3-ft.) diameter classes, or at most into 1.5 m. (5-ft.) classes.
Stand density can be estimated in either of two ways: first, in terms of crown closure; and second, in the number of the tree crowns visible in the photograph. Both methods have their advantages. With but little practice crown closure can be estimated ocularly from aerial photographs studied under the stereoscope. Crown density scales, such as are used by the U. S. Forest Service, provide a standard of comparison. Crown closure is generally stated in terms of percentage of growth stocking, or as a decimal codifying this percentage. Thus, a density of 0.7 represents a stand in which 70 percent of the stand area is occupied by crowns of trees in the overstory.
Because the interpreter working with aerial photographs and a stereoscope can see the entire stand with literally a bird 'e-eye view, he can generally estimate stand density ocularly more accurately than it could be done on the ground. Estimates accurate to within 10 percent should be consistently obtained with high-quality photographs of average scales.
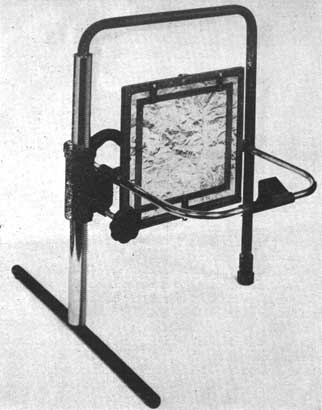
Figure 10. The Rectoplanigraph is one of the more recent types of camera lucida.
By means of crown counts, it is possible to obtain a simple numerical value of density which is relatively free from the factor of personal judgment. The disadvantages of crown counts are the difficulty of getting an accurate count and the poor correlation that is apt to exist between this count and stand volume. The experienced interpreter, however, should be able to obtain values not more than 10 percent inaccurate.
It must be remembered that aerial measurements of tree heights, crown diameter, and crown counts are influenced by the fact that only what is caught on the film in a camera several miles above the ground can thereafter be evaluated. In every photograph there is a loss of detail attributable to the great distance between the camera and the ground, the vibration of the plane, the movement of the plane during the split second that the shutter is open, and the resolving power of the lens, film, and photographic paper. On a high-quality photograph, taken at a scale of 1:15,840, the accumulated effect of this loss of detail will erase from the pictorial image all objects less than about three feet in diameter. Corresponding losses will occur at other scales. This loss of resolution will affect all measurements of trees and stands made on the photograph. For example, only that portion of the tree whose crown is more than 0.9 m. (3 ft.) in diameter will be pictured on a photograph of an average scale. Consequently, tree heights measured on such photographs will be of only that portion of the tree up to the point where the crown diminishes to three feet in diameter. This height is called the "visible tree height," and an arbitrary correction, based upon the shape of the crown, must be added before it can be compared with measurements made from the ground. Similarly, the "visible crown diameter" will measure only that portion of the crown visible from directly above, with all isolated branches of small dimensions eliminated. Also, the "visible number of trees" will include only those trees which have crowns of three feet or more in diameter visible from directly above. Once the implications of this lack of resolution are realized, however, measurements obtained from the photographs may be used with confidence in volumetric work.
Granted that the above variables can be measured with sufficient precision on aerial photographs, we must next ascertain their correlation with stem diameter and with volume. Stem diameter, or DBH, may be determined with fair precision from measurements of crown diameter because a high correlation exists in most cases between the two variables. Stem diameter values based upon crown diameter alone may be expected to be accurate within about 5 cm. (2 in.). A useful, rough rule-of-thumb is to assume that the stem diameter will be equivalent to one sixteenth of the crown diameter. This relationship is approximately true for many American species of the middle diameter classes. Tree height, as well as crown diameter, is correlated with stem diameter. A long tree with a given crown width will normally have a thicker stem than a short tree with the same crown width. Accurate determinations of stem diameter, therefore, should be based upon tree height measurement as well as upon crown diameter.
The determination of volume from aerial photographs, however, is much more difficult. In the case of a stand of very simple structure, such as an even-aged stand composed of a single species relatively free from defect, stand volume is closely related to tree height and crown closure. The volume of even-aged and homogeneous stands of such species as white pine and loblolly pine can therefore be determined with a fair amount of accuracy directly from the photographs. Furthermore, stand volume tables can be constructed in terms of visible total height and percentage of crown closure for use with aerial photographs.
The more complicated the stand structure becomes, however, the less accurate will be volume determinations made from the photographs because the correlation of volume with average stand height and average crown closure will be less. Nevertheless, even in such cases the volume of individual trees may frequently be determined from the photographs by means of tree volume tables constructed in terms of visible total height and visible crown diameter. If such tables are restricted to a given species and to a given site, variations in tree form will be largely taken into account and volume determinations may be approximately as accurate as those obtained from conventional volume tables based upon stem diameter and number of merchantable logs.
Actually, investigation has only begun on the possibilities of determining stand volume and tree volume directly from aerial photographs. The aerial approach appears promising and will undoubtedly be further developed within the next few years. On the other hand, it is almost certain that variations in form, cull, stem diameter, and merchantable length will prove to be sufficiently uncorrelated with the variables measurable on the photographs, so that ground measurements will be required in most timber inventory work. Such will certainly be the case where the individual species cannot be recognized with certainty on the photographs. For instance, I cannot imagine ever obtaining an estimate from aerial photographs of the volume of a culled old-growth birch-beech-maple forest with such confidence that the estimate need not be checked from the ground.
If it is admitted that one cannot expect to obtain final volumetric estimates directly from the photographs, there arises a problem of combining photograph analysis and ground measurements into a single co-ordinated and efficient timber cruise. This problem can best be understood by considering what each approach has to offer.
The values of field measurements are obvious, because many more variables can be measured on the ground than from the photograph, and all measurements may be made with great precision. Aerial photographs, on the other hand, have two marked advantages in volume estimation. First, stand boundaries and stand areas may be accurately delineated and determined on photographs much more rapidly than they can be obtained by ground methods. This factor may more than counterbalance the lesser accuracy with which individual tree volumes may be estimated from the air. Second, samples and measurements may be obtained more rapidly on the photograph than on the ground. Statistical precision, therefore, may be obtained not by taking a limited number of carefully measured samples as in ground timber cruising, but by taking a large number of samples on the photographs measured with only moderate accuracy.
It would therefore appear that the most efficient timber cruise might well be one in which the forest was broken down into homogeneous areas by use of the aerial photographs, and the area of each homogeneous group determined from maps prepared from aerial photographs. The photographs could further be used to obtain a very large number of samples of forest condition, samples which would be measured with somewhat lesser accuracy than might be obtained on the ground. After this material had been obtained from the photographs, the remaining data would be collected on the ground. With the field crews efficiently planning their work from the photographs, they would sample on the ground each homogeneous unit that had previously been classified on the photographs. The intensity of their sample might well be determined by the apparent importance of each unit as determined from the unparalleled perspective of the stereoscopic image. In this ground sampling, the volume per acre of each homogeneous unit would be determined, as would be such measurements as stem diameter, stem quality, cull, and other values not obtainable on the photographs. By applying regular volume values derived from the ground to acreage values obtained from the aerial photographs, the final volume estimate would be obtained.
There are two major approaches by which photographic analysis and ground work may be combined; the stand approach, and the plot approach.
In the stand approach, a stand map is first prepared from the photographs. Ordinarily, homogeneous stand units are delineated and classified according to composition, density, and height. The acreage of each group of homogeneous stands is determined and its relative importance assessed. For instance, white pine stands which are fully stocked and are 80 feet high obviously have a high volume of timber and should be sampled intensely on the ground. Aspen and paper birch stands, on the other hand, which have come in after a burn and which have only attained a height of 30 feet obviously have little or no merchantable volume and need not be investigated in the field to any extent.
Once the stand map has been completed, the number of plots to be taken on the ground in each condition class is determined or calculated and the field parties are provided with a definite scheme of obtaining the desired number of plots in each class. For instance, cruise lines may be laid out on the stand map or the aerial photographs in such a way that approximately the right number of plots in each condition are to be taken. Another alternative might be to locate each plot on the photograph and have the field parties take the photographs with them in the field, orienting themselves by them and locating the plots on the ground as directed. In planning the field work, it is only necessary to shake sure that the method of plot location will give an unbiased estimate of the per acre volume of each classification unit on the stand map. Per acre volumes obtained from the field are then multiplied by acreage values obtained from the stand map.
Figure 12. View of an aerial photogrammetry laboratory. Courtesy Harvard Forest.
The plot approach of combining photographic and ground work is directly analogous to the line-plot system commonly used in timber cruising. Cruise lines are laid down upon the aerial photographs, or preferably upon the maps derived from the photographs. Plot centers are established and marked at intervals along these lines. The photo-interpreter then studies each plot in the stereoscopic image and either classifies it directly in terms of composition, height, crown diameter, and stand density or indirectly in terms of merchantability or stand volume. Since the plots are mechanically spaced, the proportion of plots that falls in any one class will suffice to determine the acreage of that class. The field parties then take the photographs out on the ground and relocate specified plots, checking the accuracy of the photo-interpreter and obtaining information needed to complete the survey. Data obtained in the field are thus used to correct and to amplify the estimates made upon the ground.
Figure 13. A simple lens-type stereoscope.
There are many possibilities of combining aerial and ground techniques. A number of such highly successful combinations have been used within the past few years in various parts of the United States and Canada. Few careful experimental checks have been made, but there appears little reason to doubt but that 50 to 90 percent of ground work required by conventional timber cruising can be eliminated by the proper use of aerial photographs without impairing in the slightest the accuracy of the timber cruise. When research is completed, it should be possible to increase accuracy and efficiency of combined aerial-ground techniques.
We see, then, that major use of aerial photographs in inventory work will probably not be their direct use in volume estimation, but rather their use in controlling field work. We further see that aerial photographs are destined to be an indispensable tool in forest inventory for three major reasons.
First, stand maps developed from aerial photo graphs provide an inexpensive and accurate area control. The accuracy of any forest inventory can be increased if the acreages can be obtained rapidly and inexpensively from aerial photographs. It follows that less field work is necessary when photographs are used than would be necessary to obtain the same degree of accuracy without acreage control by photographs.
Second, stand maps developed from aerial photographs provide a highly effective means of stratifying a ground cruise. Plots may be located where they will make the maximum statistical contribution to the accuracy of the inventory estimate. Unnecessary plots may be eliminated. With a fewer number of total plots than would be required for an uncontrolled cruise of the same degree of accuracy, a heavier sample can be taken in the higher-volume, higher-value, and more variable types; while the intensity of sampling can be reduced in the lower-volume, lower-value, and more homogeneous types.
Third, the use of aerial photographs in the field permits the field parties to obtain their data with a maximum of efficiency. Nonproductive areas may be left out; swamps and other areas of bad going may be bypassed; and much compass and pacing work may be eliminated. With photographs, the field party can keep themselves constantly located and can choose the best route from one place to another. A word of caution should be added. In using aerial photographs to control field inventory work, it is important to remember that the photograph is not an accurate map. For this reason it is well to rely upon stand maps constructed from the photographs, rather than the photographs themselves, except where high-quality, low-tilt photographs of level terrain are available. In rough terrain, photographic images are displaced in large amounts and scale varies throughout. If photographs of such terrain are used directly in controlling inventory, it will be found that at the higher elevations areas are overestimated and sampling is overintensive, while at the lower-elevations, areas are underestimated and sampling insufficient.
To sum up, whether the photographs should be used directly in volume estimation or used indirectly in connection with ground inventory depends upon a number of factors. It would appear that volume estimation directly from aerial photographs will prove rapid and efficient when (1) stand volume is closely correlated with photographic measurements, (2) applicable volume tables are available, and (3) relatively large scale, recent photographs of the proper specifications may be used. Under such conditions, ground checking is reduced to a minimum. Even where less satisfactory conditions prevail, however, photographs will constitute an essential tool in forest inventory because of their value in classifying the forest into homogeneous units, in stratifying the ground survey, in controlling movement of field parties, and in providing accurate area data.
![]()
![]()
![]()