![]()
![]()
![]()
Professor ERIK HAGBERG
Head of the Department of Forest Survey, Forest Research Institute of Sweden
In order to arrive at a correct judgment concerning forestry questions of current interest, a knowledge of the condition of the forests and the changes occurring in them is required. It is the task of the national forest survey to supply the necessary information in this respect. This information includes data concerning the size and composition of the growing stock, the rate of growth and - from the new type of inventory started in 1953 - also the present drain. In addition, the survey gives a land classification including a detailed description of the forest area.
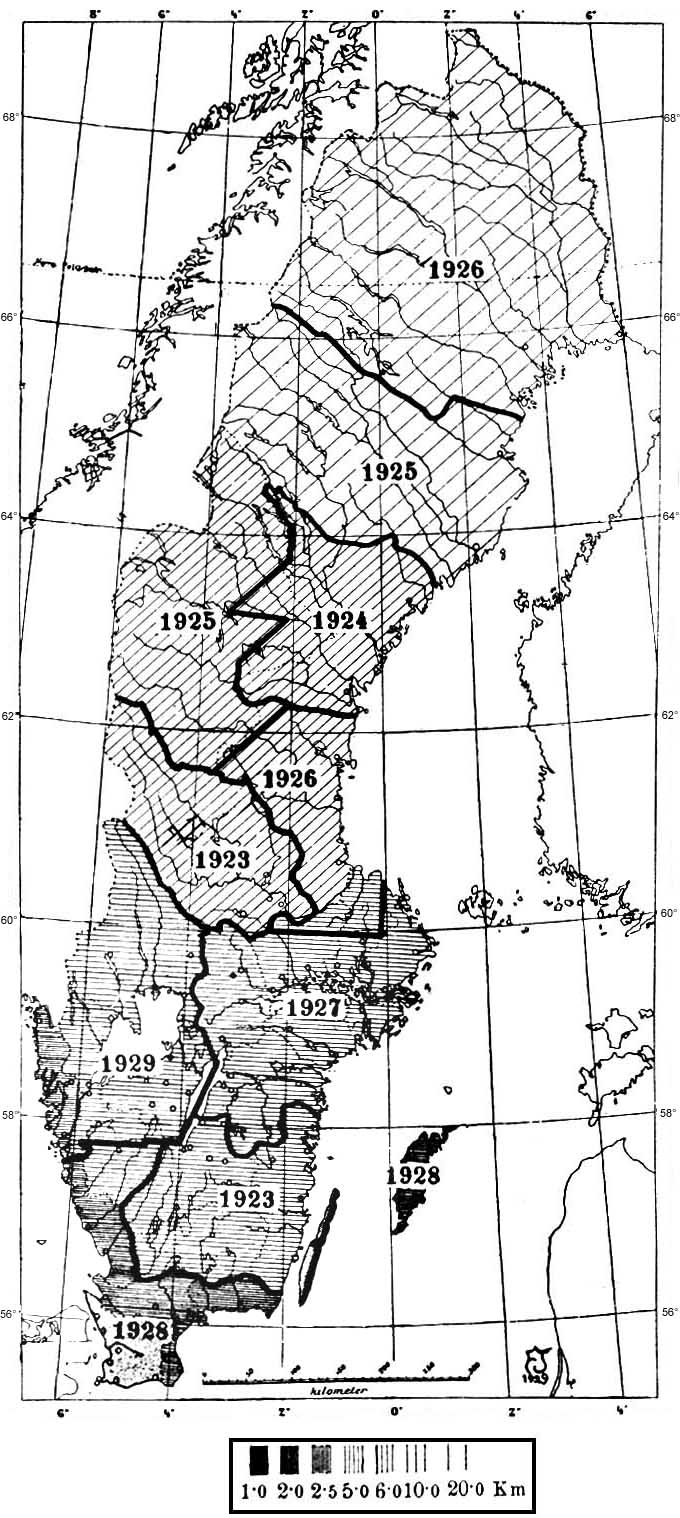
The first national forest survey, carried out in 1923-29, was of a pure strip- (or line-) survey type, i.e., the estimates were made within parallel strips 10 meters in width located at fixed distances apart (see Figure 3). The area was registered in meter lengths by continuous linear measurement along the lines, and all trees within the survey strip were recorded and distributed according to species and diameter classes (5-centimeter classes). In order to obtain the factors for computing the volume and the growth, sample trees were selected according to a certain quotient system, and detailed measurements of these trees were then made with regard to their diameter at breast height, bark thickness, height, increment, age, etc.
The second national forest survey was carried out in 1938-52 as a line plot survey along a line system similar to the one employed in the first survey, although the dine spacing was somewhat closer. As before, the area was registered by continuous linear measurement along the survey lines. In addition, however, the distribution of the area was also recorded on the sample plots for stocktaking, located at fixed intervals along the lines. Various forms and sizes of sample plots were tested. The most suitable type proved to be circular plots within an area of about 140 square meters. All trees on these plots were recorded according to species and diameter-classes, and sample trees were selected in accordance with a certain system. The sample trees were measured to obtain the factors required for computing the volume (diameter at breast height, bark thickness, tree height, height to lower crown limit); they were bored for age and increment, and the terminal shoots were measured. In northern Sweden (Norrland and Dalecarlia), a complete strip-survey, including a tree tally within a 10-meter wide strip, was carried out together with a stock inventory on sample plots in order to obtain material for a comparison between the two methods of survey. This comparison showed that although the percentage of surveyed area was considerably lower, the sample plot method gave a result only slightly less accurate than the strip-survey. Since plot-surveying can be carried out at a much lower cost, this type of survey was subsequently employed exclusively in the surveys of central and southern Sweden.
FIGURE 4. Division of Sweden into regions in the new national forest survey.
FIGURE 5. A survey tract in Region III with sample plots.
1- Sample plots for tree tallying, and for measuring basal area and radial increment (16 plots per tract).
2- Sample plots for measuring height, terminal shoots, etc.(4 plots per tract).
3- Sample plots for stump enumeration (64 plots per tract).
FIGURE 6. The distribution of one year's survey tracts (Region III)
The earlier national forest surveys had been performed as provincial inventories, i.e., one or two provinces were surveyed each year. This method of surveying was accompanied by a serious disadvantage, however, inasmuch as the results for the whole country were partly based on up-to-date figures and parry on figures which were as much as 15 years old. In the new inventory, started in 1953 and planned to be completed in 1962, this disadvantage has been eliminated by adopting a low-percentage inventory which covers the whole of Sweden and is repeated each year; thus after 10 years the country will have been surveyed with the same percentage as that employed in the second national forest survey. Actually, this means that the new inventory includes a whole series of annual national surveys.
A new phase involving cutting statistics in the form of a stump-enumeration has been added to the survey. Thus, it is possible to give an annual account of the volume cut in the same units (forest cubic meters) as the growing stock and the increment and with the same distribution of tree species and diameter classes.
After each annual survey, the new inventory provides reliable data for the whole country and, after two years, figures are obtained for the northern (Regions I-II) and southern (Regions III-V) halves of the country. (With regard to the division of Sweden into regions, see Figure 4). After the third or fourth gear, reliable figures can be given for each of the five separate regions, and after ten years, i.e., at the and of the survey cycle, for the different provinces also Sweden is divided into 24 administrative units, called län. The growing stock-and the changes it undergoes-may be followed throughout the whole of Sweden or in parts of the country by the new method in a way that was not possible when using the old methods. Thus, a balanced account may be prepared at intervals of several years - or annually between the growing stock at the beginning of the interval with the addition of growth and the deduction of fellings on the one hand, and the growing stock at the end of the interval on the other hand.
The survey "tracts"
It was intended to carry out the new inventory as a line plot survey on the same fundamental principles as those adopted in the second national forest survey of central and southern Sweden. The system of survey lines employed in the second survey was also used as a basis in planning the new inventory. As described above, each annual survey was intended to cover the whole country and would include one-tenth of the total area surveyed in the previous inventory. This principle was applied as follows, the sample plots being of the same size and located at approximately the same intervals along the lines as in the previous survey: half the length of every fifth line in the old linear system was to be surveyed each year (1/2 x 1/5 = 1/10). The annual strip along a line to be surveyed in this manner was not measured in one continuous sweep. The whole length of the line was divided into sections of 4.8 to 8.8 kilometers. Every second of these linear sections was surveyed in the course of a year. Each of these sections was called a "survey tract." Instead of surveying these tracts along a straight line, it was found preferable to carry out the survey along the four sides of a square. In this way, the time wasted during the field work could be considerably reduced, the survey starting and ending at approximately the same point. The total length of the four sides of the square is equal to the length of the corresponding linear section of 4.8 to 8.8 kilometers. The lengths of the sides of the tracts (or squares) were chosen so that the total length of the whole tract would correspond approximately to a day's work, being arranged as follows:
|
Region |
Kilometers |
|
I |
4 x 2.2 = 8.8 |
|
II |
4 x 1.8 = 7.2 |
|
III |
4 x 1.6 = 6.4 |
|
IV |
4 x 1.4 = 5.6 |
|
V |
4 x 1.2 = 4.8 |
The main principle employed in setting out the survey tracts may be seen from the following sketch:
In the sketch, the full lines indicate survey lines, the broken lines showing boundaries of survey districts; within each survey district, the ten annual tracts of the survey cycle (1 = tracts to be surveyed during the first year, i.e., in 1953, 2 = tracts to be surveyed during the second year, i.e., in 1954, etc.) have been grouped along the five survey lines in order to obtain as uniform a spacing of the survey districts as possible after each new annual survey.
As may be seen from the sketch, each survey tract has one of its four sides in common with the corresponding linear strip of the second national forest survey. This fact renders it possible to compare the results of the two surveys, especially with regard to land-use classification (forest land, cultivated land, waste land etc.). Changes in land classification caused by the conversion of cultivated land into forest land, or of bogs into cultivated or forest land by drainage, may be studied more conveniently by making a repeated inventory of one and the same line section. An entirely accurate comparison is not feasible since it is not possible to follow the survey line strictly in the field.
Area register
The principles adopted for detailed recording in the field are roughly the same as those employed in the second national forest survey. Thus, an area register is made along the survey line, dividing the measured length-in meters-into land-use classes. The forest area is subdivided into different classes such as forest land proper or pasture forest land, ownership groups, site classes (with regard to the yield capacity of the soil), cutting classes (according to the form of felling that should be employed in the various stands such as cleaning in seedling stands, sapling stands or young stands, thinning in medium-aged forests, and regeneration felling in mature forests; denuded forest land is also registered as a special cutting class); in addition reproduction measures recently undertaken are recorded.
The sample plots
The growing stock is estimated on circular sample plots having a radius of 6.64 meters, i.e., with an area of about 138 square meters. There are 4 plots per tract side (in Region V, the number is increased to 7 plots per tract side owing to the comparatively low percentage of forest land in this area). The average interval between the sample plots along the survey line is: for Region I, 550 meters; Region II, 450 meters; Region III, 400 meters; Region IV, 350 meters; Region V, 170 meters. By way of simplification, the plots are laid out in even hundreds of meters, however, and the actual intervals will therefore differ somewhat. Figures 5 and 6, showing a survey tract in Region III, will afford an idea of the location of the sample plots.
On a special sample-plot sheet the land-use class of the sample plot, site conditions such as vegetation, exposure to wind, and slope of the ground are recorded; furthermore, various forestry data already available from the area register sheet are noted, such as ownership, productivity, cutting-class and any reproduction measures undertaken. In addition, the age class, degree of density, general condition of the stand, and a description of the previous development of the stand (origin, previous fellings) are included and forestry measures suggested.
The volume is subsequently obtained by tallying all trees on the plot according to species and 5-centimeter-diameter classes at breast height; this is done on the tree-tally portion of the sample plot sheet.
The sample trees
Sample trees are chosen from among the tallied trees on the plots, according to certain methods. Detailed measurements are made of the factors determining volume, growth, age and quality. The sample trees are selected on concentric plots, the radius of which varies from 1 meter for the smallest diameter classes to 6.64 meters (= the standard plot radius) for the largest. In Region III, for instance, the sample trees were selected as follows:
|
Diameter class |
Plot |
|
|
Type |
Radius, in meters |
|
|
0 - |
circular |
1.00 |
|
5 - |
circular |
1.64 |
|
10 - |
½ - circular |
3.29 |
|
15 - |
½ - circular |
4.93 |
|
20 + |
circular |
6.64 |
The figures for the radius refer to the detachable sections of the 5-meter pole used in measuring the height of the sample trees; the center of the concentric sample tree plots coincides with that for the standard sample plot.
The total number of sample trees was chosen with a view to ensuring the required precision of the results, and the distribution of the total number among the various diameter classes was made in approximate proportion to the mean cubic volume of the respective classes.
As described above, the measurements of the sample trees include the factors determining the cubic volume: diameter at breast height, double bark thickness, tree height and the height to the lower crown limit. By means of these data the cubic volume of each sample tree, inside and outside bark, is computed with the aid of Näslund-Hagberg's volume tables, which are based on Näslund's large volume functions. The cubic volumes of the individual sample trees are then added up for each tree species and diameter class, after which mean cubic volume for the different classes is computed. By multiplying the mean volume by the number of trees tallied in the corresponding diameter class on the sample plots, the cubic volume per hectare is determined, and finally, by multiplying the figures obtained by the area of the district or region in question, the total volume is worked out.
In addition, the sample trees are bored for increment and age. The cores are forwarded to the central bureau in Stockholm, where they are measured in machines specially constructed for measuring annual rings by the Swedish Forest Research Institute. By these measurements the annual diameter growth for the preceding five years is determined; thus the diameter at breast height may be computed for five years preceding the survey. By measuring the diameter growth for each year during this five-year period, data are obtained for calculating the growth variation of different tree species in various regions in relation to average growth studied over a relatively long period. The height growth of the sample trees during the five-year period is estimated by measuring the leading shoots with special field-glasses. When the diameter and height both at the time of the survey and five years earlier are known, the corresponding two volumes of each sample tree may be obtained from the volume tables based on Näslund's small volume functions; the difference between these two cubic volumes is equivalent to the growth of the sample tree during the five-year period. On adding up the growth of the sample trees by species and diameter classes and dividing the resulting sums by the corresponding volumes at the time of the survey, volume growth percentages (discount percentage) are obtained. By applying these percentages to the cubic volume per hectare or to the total volume as computed above, the growth volume during the five-year period investigated may be obtained, excluding the growth of trees felled.
The age of the sample trees (at breast height) is determined by counting the annual rings of the increment cores. The actual age of the tree is then obtained by adding the number of years taken for a tree to attain breast height. The age thus determined is checked against the age-class estimate made in the field.
Finally, the sample trees on the sample plot are also appraised as to quality, i.e., defects are recorded as well as the estimated division of the trees into different assortments of timber (veneer wood, saw timber, pulpwood, joinery wood, fuel wood).
Marking the trees for felling
In connection with the tree enumeration on the sample plots, the crew leader marks, and registers separately, trees which from a purely silvicultural point of view should be cut in the immediate future. This "sample cut" corresponds to the volume which should be felled during a period equivalent to the appropriate interval between thinnings. This interval varies in different parts of the country; the following average figures are given: 20 years in Region I-III, 10 years in Region IV, and six years in Region V. The chief purpose of "sample marking" is to obtain a general conception of the volume to be cut according to a certain silvicultural method regarded as rational. It is employed as a basis for making felling calculations. The marking results may require some modification in the final calculation with regard to a surplus or a deficit of overmature or mature timber, or to the difficulties in carrying out regeneration measures within a reasonable time in stands that should be cut according to the marking.
Stump enumeration
Felling statistics which constitute part of the national forest survey, are obtained in the field in the form of a stump enumeration, and are prepared as follows. At every 100 meters along the survey strip observations are made of fellings undertaken during the last felling season as well as during the last season but one. When making the observations, attention should be directed to an area within 20 meters from the 100 meters mark; the stump enumeration itself is, however, performed within a circular plot having a radius of 6.64 meters. The fact as to whether fellings of the above kind have been carried out or not is registered at every 100 meters on a special stump enumeration sheet. Where fellings have been made, certain stand characteristics of the plot are recorded (site class, age class, etc.).
In addition, the season must be determined during which cutting has occurred. The beginning of the period of growth each year has been chosen as the boundary between different seasons. Thus, by adopting "vegetation years" instead of calendar years, the distinction between cutting seasons is considerably facilitated. It will now first be necessary to investigate whether cutting was undertaken during the winter or summer. Summer fellings are recognized by the fact that the terminal growth has started, which may be seen from tops and limbs left on the ground.
The beginning of the growing season naturally varies from year to year and from district to district. However, stumps which have not been registered one year will be included in the following year, and the average for several years may therefore be regarded as correct. Owing to the fact that very few fellings are made during the period in question, the number of borderline cases will be very small. The next point consists in distinguishing between the last season's summer failings and the summer fellings of the last season but one, and also between the winter failings of the two seasons. This is done chiefly by judging the general appearance of the stump, the color of the needles on tops and branches left on the ground, remnants of sawdust close to the stump, or the occurrence of recently fallen needles in the saw notch of stump. Although these indications are usually quite clear, uncertainty may arise in some instances. Where this is the case, increment cores are taken from the stump and from a tree standing nearby ("twin tree"). Comparative annual ring diagrams are then plotted, from which the season can, as a rule, be ascertained.
When stumps are found within the circular plot, these should be registered on the sheet according to tree species and stump diameter classes. The stump diameter must, however, be converted to the breast-height diameter in order to enable the volume of the felled trees to be computed. To this end, one or two sample trees ("twin trees") per plot of the species occurring are calipered, both at stump height and breast height. These twin trees should be situated on the plot itself or in its immediate vicinity (the same stand), and their stump diameters should roughly correspond to the diameters of the stumps in question. In addition the age class of the twin trees and the productivity class of the site is recorded. When computing the quantity cut, the felled trees are grouped together in breast-height-diameter classes and subdivided into age and site classes. The volume is then obtained by taking empirical mean heights for different ages and sites of trees marked for cutting.
The new national forest inventory annually surveys about 1,000 survey tracts, 10,000 sample plots for stock taking on forest land, and 40,000 sample plots for stump enumeration, likewise on forest land; approximately 20,000 sample trees are measured annually.
Compiling the survey material
All data from the field work are registered on punched cards (the Powers system). The forms filled up in the field are sent in weekly to the central bureau in Stockholm. Here the forms are first carefully checked. The data are then entered on the cards by means of a punching machine in accordance with the codes given on the form for each class of data. The codes refer to the columns on the punched cards, and the machine produces perforations in the cards in a position corresponding to the code in question. Four different types of cards are used, corresponding to the four forms employed for field work, namely one type for punching the data from the area register along the survey line, a second for all the descriptive data and the tree-tally on the sample plots, a third for the sample-tree measurements, and finally, a fourth card for the stump enumeration. In order to check the punching operation the cards are repunched from the original forms by a second operator. The cards are then passed through an automatic verifier, which checks the agreement between the original punching and the repunching. When it is desired to extract information from the punched records, the latter are placed in the automatic sorter. This machine, by mechanically registering with the perforations in the cards, automatically groups and arranges them in whatever order may be required for the further work of compilation. If necessary, the cards thus arranged are then placed in the so-called tabulator which adds up and converts the information represented by the perforations into figures and prints the results on special lists. The final tables are then prepared on the basis of these tabulator lists.
Results
As mentioned earlier, the annual area actually surveyed constitutes a very small percentage of the total land area. The standard errors do not, however, exceed ± 1.3 percent for the cubic volume per hectare for instance in the whole country; on the completion of the survey cycle of 10 years this figure will be reduced to only ± 0.5 percent. This implies that in 100 similar samplings the result in 95 cases would lie within twice this margin of precision. The standard error in the estimate of the annual total quantity felled according to the stump enumeration is ± 4 to 5 percent. Concerning the results hitherto achieved, see Tables 1 to 5.
Organization
During the field work season, 12 to 14 survey crews are at work each summer. The central bureau organization is represented by the Department for Forest Survey of the Forest Research of Sweden in Stockholm; this department employs some 30 persons.
The inventory is facilitated by the fact that the survey crews are equipped with a Volkswagen motorbus.
TABLE 1. - TOTAL STOCK ACCORDING TO THE SURVEYS IN 1953 AND 1954
|
Region |
Forest area in millions of ha. |
Total stock in millions of m³ |
Increase percent |
Number of years between the years |
|||
|
Survey 1953 |
Survey 1954 |
Survey 1953/54 |
Previous survey (1938-52) |
||||
|
I-II |
11.2 |
796 |
828 |
815 |
723 |
+ 12.7 |
13.0 |
|
III-V |
11.7 |
1 327 |
1 329 |
1 327 |
1 193 |
+ 11.2 |
6.0 |
|
I-V |
22.9 |
2 123 |
2 157 |
2 142 |
1 916 |
+ 11.8 |
9.5 |
TABLE 2. - DISTRIBUTION OF GROWING STOCK BY TREE SPECIES: REGIONS I-V
|
Species |
Total stock, in millions of m³ |
Increase compared with survey of 1938-52, percent |
|||
|
1953/54 |
Previous Survey (1938-52) |
1953/54 |
1953 |
1954 |
|
|
Pine |
861 |
769 |
+ 12 |
+ 11 |
+ 13 |
|
Spruce |
953 |
844 |
+ 13 |
+ 11 |
+ 14 |
|
Hardwoods |
328 |
303 |
+ 8 |
+ 9 |
+ 8 |
|
All species |
142 |
1 916 |
+ 11.8 |
+ 10.9 |
+ 12.6 |
TABLE 3. - DISTRIBUTION OF GROWING STOCK ACCORDING TO DIAMETER CLASSES REGIONS I-V
|
|
Diameter class |
|||
|
0-14 cm. |
15-24 cm. |
25 + cm. |
Total |
|
|
in millions of cubic meters |
||||
|
Previous survey (1938-52) |
591 |
777 |
548 |
1 916 |
|
Surveys 1953/54 |
611 |
861 |
670 |
2 142 |
|
Increase |
percent |
|||
|
1953/54 |
+ 3 |
+ 11 |
+ 22 |
+ 11.8 |
|
1953 |
+ 3 |
+ 9 |
+ 20 |
+ 10.9 |
|
1954 |
+ 2 |
+ 12 |
+ 26 |
+ 12.6 |
TABLE 4. - APPROXIMATE FIGURES FOR THE VOLUME PER HECTARE
|
|
Region |
||||
|
I |
II |
III |
IV |
V |
|
|
in cubic meters per hectare |
|||||
|
Previous survey 1938-52 |
56 |
70 |
86 |
109 |
84 |
|
Surveys 1953-64 |
69 |
84 |
99 |
119 |
96 |
TABLE 5. - PRELIMINARY FIGURES OF ANNUAL CUT
|
Species |
1952/53 |
1953/54 |
|
in millions of cubic meters |
||
|
Pine |
13.3 |
20.9 |
|
Spruce |
21.8 |
25.4 |
|
Hardwoods |
5.0 |
5.0 |
|
All species |
40.1 |
51.3 |
Note to Tables 1-3. The figures for the separate years 1953 and 1954 (where they do not give the total stock for the whole country) have only been included in the Tables in order to show the results for each of the hitherto completed yearly surveys, as they are not sufficiently accurate for publication.
Note to Tables 1-5. From Table 1 it will be seen that the total growing stock throughout the whole country has increased by 11.8 percent since the previous national forest survey (1938-62), or by an average of 1.2 percent annually. In northern Sweden (Regions I-II) previously surveyed in 1938-41, the increase is slightly less than 1 percent per year, whereas in the southern part of the country (Regions III-V) previously inventoried in 1942-52, the increase is nearly 2 percent per year. The difference between the results for the whole country-2,123 million cubic meters in 1953 and 2,167 million in 1954-is only 34 million cubic meters. From the foregoing it may be anticipated that the stock would increase by 20 million cubic meters between these two years; consequently, the agreement between the two results must be regarded as surprisingly satisfactory and must be ascribed in part to pure chance.
Table 2 shows that the relative increase in the growing stock is approximately the same for pine and spruce, and somewhat lower for the hardwoods. The relatively unit form figures for the different years 1953 and 1954 serve in some degree to confirm the probability of the results, even after their distribution into tree species, although partial results of this kind will naturally have a higher mean error than the total results.
With regard to the distribution of the growing stock into diameter classes (Table 3), fairly close agreement is also found between the results obtained in 1963 and 1954. For instance, the mean figure for the increase in the growing stock in diameter class 26 centimeters (25 centimeters or more), namely, 22 percent, must be regarded as fairly accurate, since the two partial results are 20 and 25 percent respectively. The latter figure should apparently be higher than the former on account of the general change in the growing stock in the direction of larger diameters which is obviously occurring.
Table 4 is solely intended to give an outline of the changes in the cubic volume per hectare in the different regions. The new inventory cannot provide more reliable figures after surveys extending over only two years where such a widely differentiated distribution as that into regions is adopted. Nevertheless, even with this distribution the results obtained are by no means improbable.
The results of the stump enumeration as shown in Table 5 agree quite satisfactorily with the figures published by the Royal Board of Private Forestry over the annual cut for the different felling seasons. Complete agreement between the figures of the Board and those of the national forest survey cannot be attained, however, on account of the difficulties involved in getting the corresponding "felling years" to coincide exactly in time, among other reasons.
A party consists of six or seven men, including a crew leader who has been trained in a forestry school or in the college of forestry, a foreman, a compass man, in some cases a separate caliper-man, two chain-men and a combined cook and chauffeur.
Costs
The total costs for the new national forest survey are estimated at about 450,000 Swedish krone (about of U.S.$ 87,000) yearly, or 2 öre (U.S.$ 0.04) per hectare forest land, i.e. 20 ore (U.S.$ 0.004) per hectare of forest land for the whole survey cycle. About 55 percent of the total amount is allotted to field work, and 45 percent to office work, which, in addition to the regular tasks described above, also includes a variety of special investigations and calculations.
It may naturally be asked whether the National Forest Survey has really been improved by the new method, singe after two years' surveying it is only possible to present the somewhat general results given above. In earlier inventories a detailed account of forest conditions could be given at the end of each year for one or two provinces. It must be borne in mind, however, that the new type of survey already affords a complete picture of the timber situation in the whole country at the end of one or two years; the older types could only give the corresponding figures after the completion of the survey cycle, and furthermore these figures were obtained from the results for provinces surveyed at different times. Moreover, the full effect of the new form of survey will not become apparent until the results for regions and provinces are available after a certain number of years, consecutive annual reports for such districts will then be obtained instead.
Again, apart from the growing stock, the new survey also gives data relating to annual growth and drain. The figures for the annual drain form the basis of the yearly felling statistics for the whole country. By this means an old statistical problem, which has been troubling authorities and experts for many decades, has found a satisfactory solution. This applies to the total cut which can now be expressed in "forest cubic volume" (i.e., total stem volume of standing trees). This solution was only rendered possible by organizing the national forest survey on the new lines.
The new type of survey will thus provide the means for a continuous control of the timber situation in the country in a far more satisfactory manner than hitherto, and must therefore be regarded as a progressive step in the field of timber statistics.
![]()
![]()
![]()