![]()
![]()
![]()
This report deals chiefly with the development of the European sawn softwood market in the postwar period, but also with North America and the U.S.S.R. It will be of interest at this time when changes in the structure of the European economy are under discussion, such as the introduction of the European Economic Community and other efforts at economic integration.
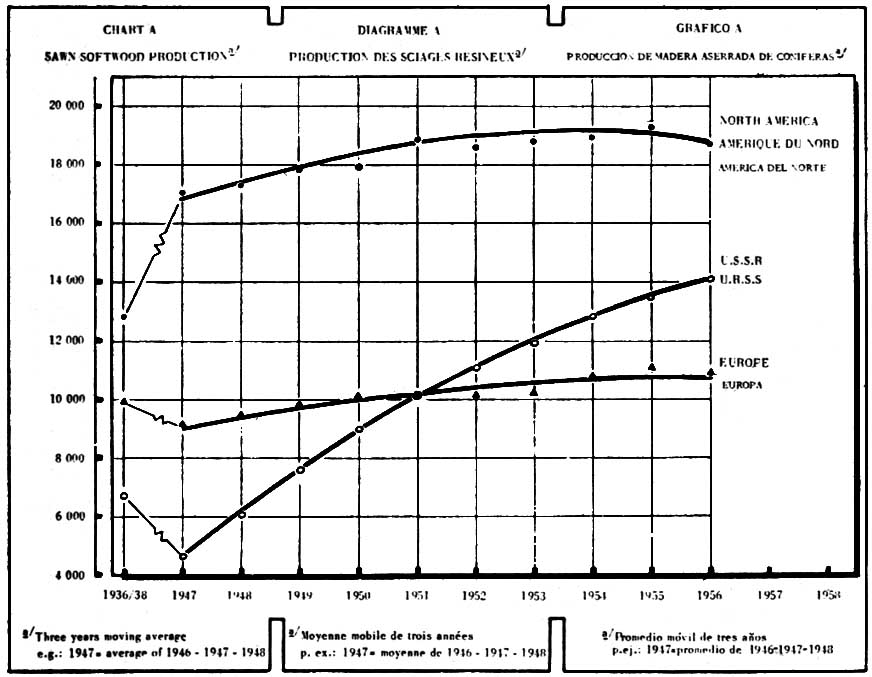
The trends in production of sawn softwood over the years 1946 to 1957 are shown in Chart A which in turn is based on the detailed statistics in Table 1. Output has been rising rapidly in the U.S.S.R. but is generally stabilized in Europe and in North America.
Development of forest industries has reached a high level in both Europe and North America and in Europe especially the sustained yield limits for the forests as presently managed are being approached. In the U.S.S.R., however, many areas of forest are only just being opened up for exploitation and considerable expansion in output can be achieved before either demand is met or the capabilities of the forests are reached.
After the setback during the years of the second world war, sawmill capacity in both Europe and the U.S.S.R. recovered and prewar output volumes were surpassed. North American production increased during the war and continued to increase, but at a slower rate, for several subsequent years.
TABLES 1, 2 AND 3. - SAWN SOFTWOOD: PRODUCTION, EXPORTS AND IMPORTS (in thousands
of standards)
TABLE 1. - PRODUCTION
|
Region |
1936/38 |
1946 |
1947 |
1948 |
1949 |
1950 |
1951 |
1952 |
1953 |
1054 |
1955 |
1966 |
1957 |
|
Europe¹ |
9960 |
8835 |
9235 |
9390 |
9850 |
10185 |
10545 |
9670 |
10270 |
1080 |
11275 |
10950 |
10530 |
|
U.R.S.S. |
6760 |
3560 |
4400 |
5950 |
7780 |
9010 |
10190 |
11000 |
12080 |
12550 |
13750 |
13930 |
14370 |
|
North America |
12720 |
15320 |
17270 |
18150 |
16250 |
13910 |
18550 |
13770 |
18560 |
18430 |
19990 |
19040 |
17070 |
TABLE 2. - EXPORTc
|
Region |
1936/38 |
1946 |
1947 |
1948 |
1949 |
1950 |
1951 |
1952 |
1953 |
1054 |
1955 |
1966 |
1957 |
|
Europe¹ |
2905 |
1015 |
1485 |
2835 |
2355 |
2785 |
3105 |
2470 |
2990 |
3185 |
3295 |
3005 |
3165 |
|
U.R.S.S. |
1227 |
68 |
54 |
98 |
196 |
222 |
20 |
160 |
279 |
373 |
498 |
472 |
736 |
|
North America |
6235 |
1255 |
1775 |
1410 |
1325 |
2050 |
2215 |
2000 |
1985 |
2385 |
2693 |
2310 |
2185 |
TABLE 3. - IMPORTc
|
Region |
1936/38 |
1946 |
1947 |
1948 |
1949 |
1950 |
1951 |
1952 |
1953 |
1054 |
1955 |
1966 |
1957 |
|
Europe¹ |
4100 |
1315 |
2020 |
1810 |
2270 |
2420 |
3075 |
2555 |
3115 |
3515 |
3825 |
3315 |
3815 |
|
U.R.S.S. |
- |
47 |
86 |
147 |
205 |
217 |
197 |
266 |
213 |
166 |
131 |
105 |
89 |
|
North America |
1375 |
530 |
585 |
855 |
750 |
1620 |
1185 |
1200 |
1330 |
1500 |
1755 |
1680 |
1455 |
a Includes Turkey, excludes U.S.S.R.
b Total known, breakdown into sawn softwood by Secretariat.
c Total intra- and interregional.
The annual statistics (Table 1) show that while U.S.S.R. output increased steadily
from 3.5 million standards in 1946 to nearly 14.5 million standards in 1957,
the production of North American and European sawmills has been subject to fluctuations.
In Europe, a drop in output was experienced in 1952 and again in 1956 and 1957.
A peak year in European production was 1955, with over 11.25 million standards.
In several countries, policies for protecting reserves of foreign exchange and
guarding against inflationary tendencies, have served to restrict construction
activities and thereby the demand for sawnwood. In other countries, measures
have been taken to restrict forest outturn in order to reduce overcutting or
to build up growing stock. Changes in technology and in consumer habits have
contributed to the increase in competition between sawnwood and other building
materials, both wood products and others, generally to the detriment of sawnwood.
Among major producing countries of Europe, the postwar growth in sawn softwood output was particularly noteworthy for Poland (from about 410,000 standards in 1946 to 1,362,000 standards in 1957) and Austria (269,000 to 840,000 standards) where worn-out industries have been rebuilt. Declining production has been recorded for Germany, both Western and Eastern, as overcutting has been scaled down toward the sustained yield capacities of the forests.
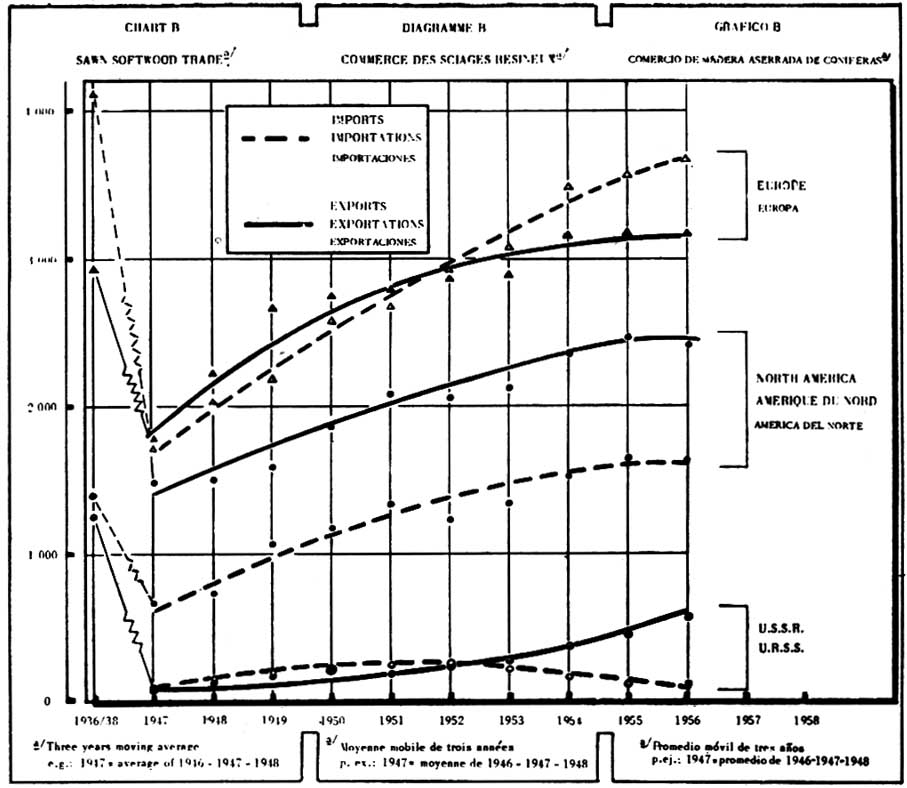
Trade
According to the export statistics (Table 2), nearly a third of the 1957 European production was traded outside the producing countries. The trend in exports for Europe, U.S.S.R. and North America has been generally upward (Chart B) in the postwar years, but prewar levels were not attained in the case of Europe until 1953, and exports of the other two areas remain well below prewar levels. According to available figures, the annual sawn softwood exports of the U.S.S.R. averaged nearly 1.25 million standards during the prewar period 1936/38, dropped to an annual average of less than 75,000 standards in the immediate postwar years and recovered gradually to 736,000 standards in 1957.
North American exports of sawn softwood apparently have had relatively little impact on the European market, and even when domestic demand has decreased there has been little increase in overseas marketing. Canada now ships about three quarters of its total exports of sawn softwood to its southern neighbor, the United States of America. In the three immediate postwar years, these shipments constituted slightly less than half Canada's sawn softwood exports.
The average annual volume of North American shipments of sawn softwood to Europe declined from 566,000 standards during 1946/48 to less than 360,000 standards in 1955/57. European needs for large dimension timber may be considered to provide a "floor" to the volume of imports from North America below which average imports are not likely to fall.
During the period 1948 to 1951, in spite of the great internal needs for building materials, Europe was a net exporter of sawn softwood (Chart B). Since that time, however, imports have increased faster than exports until in 1957 they exceeded the latter by 650,000 standards. A major supplier of sawnwood for Europe has been the Soviet Union with shipments of 343,000 standards in 1954, 438,000 in 1955, 443,000 in 1956 and 689,000 in 1957.
Consumption
Disregarding changes in stocks, the (apparent) consumption of sawn softwood may be calculated from production and trade data (Tables 1, 2, 3) to show the following (Table 4):
TABLE 4. - AVERAGE ANNUAL APPARENT CONSUMPTION
|
Region |
1936/38 |
1946/48 |
1955/57 |
|||
|
Total, in 1,000 stds |
Stds per 1,000 capita a |
Total, in 1,000 stds |
Stds per 1,000 capita a |
Total, in 1,000 stds |
Stds per 1,000 capita a |
|
|
Europe (excl. U.S.S.R.) |
11 155 |
29 |
9 090 |
22 |
11 415 |
26 |
|
U.S.S.R. |
5 535 |
29 |
4 660 |
27 |
13 560 |
68 |
|
North America |
7 860 |
56 |
16 190 |
100 |
17 930 |
97 |
a Basis, population 1937, 1948, 1956.
These figures show relative stability in per caput sawn softwood consumption in Europe and North America since the last war. A different stage of development exists in the U.S.S.R. and per caput consumption is increasing as additional supplies are made available to the economy.
It is expected that these trends will continue for the next several years. North American and European unexploited timber resources are no longer available at costs which would make sawn softwood more competitive with other construction materials. In the U.S.S.R. on the other hand, forest resources are still only partially developed and continued expansion in production and exports can be anticipated.
After the weakening recorded in 1956, the European sawn softwood market in 1957 showed a greater upward trend than had been expected. Total imports reached 3.9 million standards as against 3.4 million standards in 1956. The increased volumes imported by western Germany, Eastern Germany and the United Kingdom were the most marked, but several other countries also bought more sawn softwood from European sources.
A number of factors were responsible for this development. Mild weather enabled building activity to continue through the usually slack winter months. Importers' stocks were low at the beginning of 1957, as they had been sharply reduced in the course of 1956 in a number of importing countries due to the increased financial burden of stock holding consequent upon tighter credit and dearer money, and because of apprehensions on the future course of sawnwood consumption. The higher demand evoked an adequate response from the exporting countries, by Austria on account of a high volume of storm-fellings, and by Sweden by drawing upon available stocks. Importers were able to build up their stocks, and at the end of 1957 stocks were high in most importing countries.
Events on the European sawn softwood market in the course of 1958 have again demonstrated the sensitivity of this market to general trends in the European economy. In autumn 1957 there was a good deal of uncertainty as to the extent to which the curbs then being applied to the economies of several European countries would affect the development of industrial and constructional activity. The hope of continued stability which prevailed at that time was linked to a moderately optimistic assessment of general economic trends.
In fact, these hopes were not realized: the year 1958 was not on the whole a favorable one for the European timber market, although it should be noted that this does not apply to the whole of Europe, nor could it be described as a serious recession. While the setback was certainly pronounced, considered against the background of the relative stability which the market has now enjoyed for five years, in magnitude it cannot be compared with recessions which the market had known in earlier years.
With industrial activity in many sectors declining in western Europe, and constructional programs running in general somewhat lower than in the preceding year, a certain fall in consumption and demand seemed inevitable. This alone was sufficient to induce a cautious approach to purchasing by the main importing countries. In addition, buyers were influenced by anticipation of price reductions and fears of the ultimate repercussions of the United States recession on the European economy. In the United Kingdom the release of the last batch of government-held stock to the trade diminished the year's import requirements.
Most exporting countries had ample supplies on offer, and some exhibited an eagerness to effect sales, but purchasing was slow and important downward adjustments of prices occurred. It was some time, however, before price concessions stimulated buying, since in many cases importers held off buying in the expectation of even further price falls.
The 1957/58 economic recession in the United States and Canada was accompanied by a sharp falling off in demand for timber. At the same time, high interest rates led to a decline in construction which contributed to a decreased rate of sawnwood production in both countries. As measured by the gross national product, the recession in the United States reached a turning point in the second quarter of 1958. Building and construction, which account for about 70 percent of United States consumption of sawnwood (including hardwood) turned upwards in June, and the consumption of sawnwood for boxing and crating and in manufactures started to improve in May and has since increased steadily.
Production
In 1957, European sawn softwood production (excluding U.S.S.R.) dropped below the 1956 level by about 400,000 standards (see Table 5). The situation was unusual in that the share of the main European exporting countries in this decline was comparatively small, being altogether only about 90,000 standards, while that of the chief importing countries was proportionately higher. This reduction was especially exemplified in the output of Western Germany which fell by some 290,000 standards. Although it should be borne in mind that this country's production for 1956 was comparatively high, partly owing to large stocks of sawlogs at the beginning of that year, and partly because of the windblown timber of 1955 being processed in 1956, nevertheless the decline shown for 1957, by comparison with 1956, was significant; in fact, production for Western Germany was, at 1,197,000 standards, the lowest since the end of the war.
The decline in total European production in 1956 had been the consequence of a lower volume of international trade in that year, but this was not the case with the 1957 decrease. On the contrary, total 1957 import figures for sawn softwood exceeded those of 1956 by some 500,000 standards. This increase in international trade in a period of decreased production was possible because, as already said, the decline in output of the main exporting countries was small and their stocks were plentiful.
TABLE 5. - PRODUCTION OF SAWN SOFTWOOD (in thousands of standards)
|
Country |
1953 |
1954 |
1955 |
1956 |
1957 |
Jan.-June |
|
|
1957 |
1958 |
||||||
|
Austria |
684 |
804 |
826 |
839 |
840 |
417 |
431 |
|
Belgium |
75 |
70 |
75 |
75 |
70 |
41 |
41 |
|
Bulgaria |
107 |
100 |
103 |
85 |
85* |
45* |
40* |
|
Czechoslovakia |
862 |
800 |
877 |
853 |
831 |
415 |
408 |
|
Denmark |
62 |
60* |
60* |
64* |
68* |
30* |
33* |
|
Finland |
904 |
1019 |
1074 |
810 |
825 |
430 |
534 |
|
France |
770 |
907 |
1018 |
1038 |
1006 |
364 |
385 |
|
Germany, Eastern |
1275 |
1263 |
1399 |
1487 |
1197 |
620 |
556 |
|
Germany, Western |
663 |
643 |
613 |
591 |
563 |
282 |
274 |
|
Greece |
34 |
37 |
37 |
42 |
38* |
11 |
13* |
|
Hungary |
16 |
15 |
13 |
10 |
15 |
6 |
6 |
|
Ireland |
7 |
5 |
5 |
5 |
4 |
2 |
2 |
|
Italy |
227 |
201 |
179 |
174 |
158 |
85* |
77* |
|
Luxembourg |
6 |
7 |
5 |
6 |
6 |
4 |
3 |
|
Netherlands |
16 |
14 |
14 |
13 |
14 |
5 |
5 |
|
Norway |
345 |
358 |
366 |
410 |
400 |
200* |
200* |
|
Poland |
1149 |
1327 |
1346 |
1320 |
1362 |
733 |
713 |
|
Portugal |
88 |
105 |
118 |
123 |
124 |
58 |
62 |
|
Romania |
690 |
684 |
546 |
586 |
576 |
296 |
261 |
|
Spain |
126 |
158 |
165 |
204 |
209 |
99 |
98 |
|
Sweden |
491 |
1600 |
1753 |
1589 |
1548 |
780* |
810* |
|
Switzerland |
195 |
198 |
218 |
218 |
199 |
116 |
107 |
|
United Kingdom |
54 |
62 |
53 |
52 |
52 |
24 |
24 |
|
Yugoslavia |
349 |
288 |
270 |
258 |
259 |
111 |
97 |
|
TOTAL, EUROPE |
10190 |
10720 |
11130 |
10850 |
10450 |
5170 |
6180 |
|
U.S.S.R. |
12080* |
12550* |
13750* |
13930* |
14370* |
- |
- |
|
Canada |
3636 |
3639 |
4032 |
3859 |
3187 |
1798 |
1823 |
|
United States |
14929 |
14787 |
15959 |
15182 |
13884 |
7060 |
6395 |
|
TOTAL, NORTH AMERICA |
18560 |
18430 |
19990 |
19040 |
17070 |
8860 |
8220 |
* Estimated
Figures available for sawn softwood production for Europe as a whole in the first half of 1958 show no appreciable changes, but marked fluctuations in output have occurred in several countries. Czechoslovakia, Poland, Western and Eastern Germany cut down their production. Finland, France and Austria stepped up output in comparison with the same period of the previous year. Production in Finland climbed from 430,000 standards to 534,000 standards - a direct consequence of the increased felling of sawlogs after the devaluation of the Finnish mark in autumn 1957. In most other countries, the level of sawnwood production was maintained or there were only minor changes. The total figure for Europe for the first half of 1958 is estimated at some 5,180,000 standards, only 10,000 standards less than for the same period of the previous year.
Production of sawn softwood in Canada during the first half of 1958 amounted to 1.82 million standards as against 1.80 million the previous year. The corresponding figures for the United States are 6.4 million and 7.1 million standards. The latter's production during 1958 is expected to total about 13.2 million standards, or 5 percent less than in 1957.
Consumption
The slowing down of building activity in several European countries in the latter part of 1957 partly contributed toward the decrease in total European consumption of 350,000 standards below 1956. This slackening in housing activity became accentuated and widespread in the course of the first half of 1958, and will doubtless be reflected in the total consumption for the year when final figures are available. However, in the second quarter of 1958 there was the same or an even higher rate of construction than during the comparable period of 1957.
Consumption in the United Kingdom declined by 9 percent in the first half of 1958 as against 1957. For Western Germany and the Netherlands, the corresponding declines were 9 percent and 19 percent respectively.
Total consumption of sawn softwood in the United States during 1958 is forecast at about 14.6 million standards, or about 3 percent below 1957 consumption and about 13 percent below the 1955 peak.
Trade
After the record volume of European trade in sawn softwood in 1955, the drop in 1956, and the recovery in 1957 (see Tables 6 and 7), 1958 is again expected to show a decrease. Although plentiful supplies were available, the atmosphere of the market was uneasy and characterized by a hesitant purchasing policy. This was due to the continuous reductions of f.o.b. prices and freight rates; uncertainty regarding future consumption; dear and scarce money at the beginning of the year in most of the importing countries; and finally speculation as to if, when, and to what extent the recession in the United States would make itself felt in Europe. At the beginning of the buying campaign importers bought only quantities that might be resold immediately. Later on, after the first price reductions, their reluctance to proceed to large-scale purchasing was strengthened by the general feeling that prices would decline even more. Thus, an almost hand-to-mouth purchasing policy continued throughout 1958.
At the beginning of the winter 1967/58 the prospect for 1958 had seemed an apparently balanced supply/ demand situation, with trade at a somewhat lower level than in 1957. But in December 1957, some exporters went into action despite the difficult import situation, and a keen competition developed. The policy of the U.S.S.R. was apparently to ensure that its volume of sawn softwood exports on the European market equalled those of the previous year. Finland was attempting to take advantage at the beginning of the season of its improved position after the devaluation. Of the exporting countries, Sweden alone remained comparatively unmoved. But this has meant a reduction in Sweden's volume of trade as a whole, and in consequence it is not unlikely that stocks at the end of 1958 will prove to have been high. At the time of writing, it seems that Scandinavian shippers may have preferred to carry over higher stocks into 1959 than they did in 1957/58.
In the United Kingdom, total imports for the first half of 1958 dropped by a good 100,000 standards from the first half of 1957; only imports from Canada exceeded the volume imported during the same period of the previous year - a period during which high freight rates virtually priced Canadian softwood out of the European market. Even the Netherlands and the Western Germany had a reduced volume of imports during the first half of 1958.
TABLE 6. - IMPORTS OF SAWN SOFTWOOD (in thousands of standards)
|
Country |
1953 |
1954 |
1955 |
1956 |
1957 |
Jan.-June |
|
|
1957 |
1958 |
||||||
|
Austria |
0.3 |
0.4 |
0.4 |
0.4 |
0.5 |
0.2 |
0.3 |
|
Belgium-Luxembourg |
104.0 |
129.0 |
147.0 |
117.0 |
142.0 |
54.0 |
31.0 |
|
Bulgaria |
- |
- |
- |
- |
1.4 |
- |
- |
|
Czechoslovakia |
7.9 |
20.0 |
20.0 |
29.0 |
65.0 |
17.0 |
19.0 |
|
Denmark |
146.0 |
174.0 |
133.0 |
106.0 |
123.0 |
47.0 |
38.0 |
|
France |
86.0 |
84.0 |
103.0 |
161.0 |
176.0 |
80.0 |
66.0 |
|
Germany, Eastern |
11.0 |
19.0 |
26.0 |
47.0 |
123.0 |
39.0 |
46.0 |
|
Germany, Western |
386.0 |
517.0 |
609.0 |
502.0 |
600.0 |
248.0 |
237.0 |
|
Greece |
31.0 |
42.0 |
40.0 |
55.0 |
53.0 |
21.0 |
20. 0* |
|
Hungary |
123.0 |
117.0 |
112.0 |
109.0 |
131.0 |
47.0 |
51.0 |
|
Iceland |
7.6 |
10.0 |
9.6 |
13.0 |
11.0 |
3.1 |
3. 0* |
|
Ireland |
34.0 |
51.0 |
53.0 |
43.0 |
26.0 |
8.1 |
20.0 |
|
Italy |
298.0 |
354.0 |
351.0 |
377.0 |
390.0 |
197.0 |
189.0 |
|
Netherlands |
333.0 |
383.0 |
404.0 |
389.0 |
422.0 |
162.0 |
89.0 |
|
Norway |
6.6 |
17.0 |
24.0 |
13.0 |
12.0 |
6.7 |
4.5 |
|
Poland |
12.0 |
- |
- |
- |
12.0 |
5.8 |
0.6 |
|
Portugal |
1.1 |
1.8 |
1.6 |
2.1 |
1.6 |
0.7 |
0.3 |
|
Spain |
6.9 |
11.0 |
13.0 |
18.0 |
12.0 |
5.3 |
9.0 |
|
Sweden |
14.0 |
15.0 |
12.0 |
7.7 |
10.0 |
2.0 |
5.4 |
|
Switzerland |
12.0 |
15.0 |
24.0 |
33.0 |
30.0 |
16.0 |
11.0 |
|
United Kingdom |
1 427.0 |
1 481.0 |
1 709.0 |
1 279.0 |
1 458.0 |
539.0 |
427.0 |
|
TOTAL, EUROPE |
3 050.0 |
3 445.0 |
3 790.0 |
3 305.0 |
3 800.0 |
1 500.0 |
1 270.0 |
|
U.S.S.R. |
213.0 |
166.0 |
131.0 |
105.0 |
89.0 |
55.0 |
41.0 |
|
Canada |
45.0 |
51.0 |
65.0 |
89.0 |
75.0 |
36.0 |
37.0 |
|
United States |
1 287.0 |
1 450.0 |
1 688.0 |
1 589.0 |
1 379.0 |
643.0 |
- |
|
TOTAL, NORTH AMERICA |
1 330.0 |
1 500.0 |
1 755.0 |
1 680.0 |
1 450.0 |
680.0 |
|
TABLE 7. - EXPORTS OF SAWN SOFTWOOD (in thousands of standards)
|
Country |
1953 |
1954 |
1955 |
1956 |
1957 |
Jan.-June |
|
|
1957 |
1958 |
||||||
|
Austria |
594.0 |
704.0 |
675.0 |
733.0 |
697.0 |
353.0 |
321.0 |
|
Belgium-Luxembourg |
0.4 |
0.8 |
3.4 |
7.6 |
5.3 |
3.6 |
2.1 |
|
Bulgaria |
- |
- |
- |
0.1 |
0.4 |
0.2 |
- |
|
Czechoslovakia |
117.0 |
126.0 |
119.0 |
90.0 |
122.0 |
46.0 |
57.0 |
|
Denmark |
- |
- |
1.1 |
5.6 |
11.0 |
5.7 |
4.0 |
|
Finland |
675.0 |
729.0 |
779.0 |
635.0 |
704.0 |
252.0 |
198.0 |
|
France |
97.0 |
101.0 |
145.0 |
91.0 |
67.0 |
36.0 |
31.0 |
|
Germany, Eastern |
3.8 |
2.2 |
0.3 |
0.1 |
2.4 |
0.3 |
1.9 |
|
Germany, Western |
6.2 |
16.0 |
11.0 |
40.0 |
40.0 |
24.0 |
12.0 |
|
Ireland |
0.1 |
0.2 |
0.1 |
0.3 |
0.2 |
0.1 |
0.2 |
|
Italy |
0.1 |
0.1 |
0.4 |
0.3 |
0.3 |
0.1 |
0.3 |
|
Netherlands |
0.6 |
1.0 |
2.6 |
1.7 |
1.9 |
0.7 |
1.4 |
|
Norway |
36.0 |
24.0 |
24.0 |
28.0 |
40.0 |
17.0 |
20.0 |
|
Poland |
56.0 |
88.0 |
88.0 |
79.0 |
64.0 |
26.0 |
18.0 |
|
Portugal |
35.0 |
52.0 |
65.0 |
71.0 |
64.0 |
32.0 |
33.0 |
|
Romania |
256.0 |
295.0 |
226.0 |
145.0 |
192.0 |
90.0 |
90.0 |
|
Spain |
0.4 |
0.3 |
- |
- |
- |
- |
- |
|
Sweden |
956.0 |
937.0 |
1 067.0 |
1 012.0 |
1 096.0 |
474.0 |
324.0 |
|
Switzerland |
2.3 |
1.8 |
1.7 |
1.2 |
1.5 |
1.0 |
0.7 |
|
Yugoslavia |
152.0 |
109.0 |
87.0 |
67.0 |
54.0 |
33.0 |
20.0 |
|
TOTAL, EUROPE |
2 990.0 |
3 185.0 |
3 295.0 |
31005.0 |
3 165.0 |
1 395.0 |
1 135.0 |
|
U.S.S.R. |
279.0 |
373.0 |
498.0 |
472.0 |
736.0 |
203.0 |
195.0 |
|
Canada |
1 745.0 |
2 102.0 |
2 381.0 |
2 034.0 |
1 877.0 |
865.0 |
881.0 |
|
United States |
239.0 |
283.0 |
315.0 |
278.0 |
311.0 |
154.0 |
- |
|
TOTAL, NORTH AMERICA |
1 985.0 |
2 385.0 |
2 695.0 |
2 310.0 |
2 185.0 |
1 020.0 |
- |
The northern exporting countries, Finland and Sweden, had by the end of August 1958 sold about 570,000 standards and 575,000 standards respectively, for delivery in the current shipping year, thus reaching about 90 percent (in the case of Finland) and only 70 percent (in the case of Sweden) of the corresponding figures of the previous year. U.S.S.R. sales to the six principal western European importing countries may for the same period be estimated at 420,000 standards, as against 455,000 standards in 1957.
Austria's sales apparently declined very slightly, despite decreased demand by the Netherlands and France; demand in Western Germany and Italy was maintained.
The weakening of the domestic market in Canada and in the United States during the first half of 1958 was in part compensated by increased exports from Canada to western Europe. From the middle of the year the economic improvement in the United States was reflected in a progressive revival in demand for imported Canadian softwood. Shipments of Canadian sawn softwood to Europe decreased considerably and were in general confined to special categories. Total imports of sawn softwood by the United States in 1958 are expected to amount to about 1.41 million standards, as against 1.38 million in the previous year.
Prices
Prices of sawn softwood on the European market remained remarkably stable throughout 1957. In 1958, drastic downward price adjustments occurred. At the same time, there was a reduction in Baltic freight rates (see Table 8) though not of the same magnitude as the drop in prices. After the devaluation of the Finnmark in September 1957, Finland should have been in the position to make some reduction in its prices; in practice, however, it was faced with considerably higher log prices, higher wages and an export levy introduced in connection with the devaluation. Moreover, the gradual lowering of this export levy, instead of ensuring wider profit margins to Finnish shippers as was no doubt intended, had to be used proportionately to reduce export prices under the threat of keen competition. The introduction of the minimum price system in Finland in the middle of the year led to softwood prices being more stable, though at a low level.
TABLE 8. - TIMBER FREIGHT RATES (1953 = 100)
|
Year: |
January |
March |
June |
September |
December |
Whole year |
|
1954 |
100 |
96 |
100 |
113 |
181 |
114 |
|
1965 |
... |
142 |
178 |
186 |
176 |
177 |
|
1966 |
183 |
194 |
192 |
204 |
... |
189 |
|
1967 |
181 |
182 |
148 |
113 |
107 |
147 |
|
1968 |
99 |
98 |
101 |
|
|
|
SOURCE: United Kingdom Chamber of Shipping.
The price reductions which did occur during 1958 have been greatest for the lower qualities. Thus, the price gap between unsorted and fifth grades has been considerably widened. A drop in prices of £ 8 (U.S. $22.40) per standard for whitewood was made in connection with the U.S.S.R's second schedule, by comparison with the February offer. Following these reductions, Sweden and Finland gradually lowered their quotations during July and August. At the end of August, Finland's best whitewood was priced at around £ 66 (U.S. $184.80) f.o.b. basis 7 inch U.S. battens. Since in a buyers' market specifications have become more and more an important factor in negotiations, it appears that the smaller undertakings with low-grade assortments and less popular categories will be faced with difficulties.
Outlook
Once again prospects for 1959 depend on what kind of assessment is made of general trends in the European economy. There are certain favorable signs. The upturn in United States business bids fair to continue.
Measures have been taken in many European countries to stimulate economic activity - easier credit, bank rate reductions, etc., which may result in improving timber consumption. Stocks in importing countries, while adequate, are no longer excessive - either in quantitative or financial terms. But while there are evident grounds for optimism - and these are reflected in exporters' estimates for 1959 - importers are anxious not to overestimate the extent of any expected increase in demand.
H. W.
The sentence: "There are no indigenous pines in the whole continent of Africa, whether tropical or otherwise" in the article "Pines for Tropical Areas" in Unasylva, Volume 12, Number 3, page 121 has been questioned by a correspondent, who cites interesting authorities to show that Pinus halepensis may be an exception to the above statement.
"If one consults Prehistory and Pleistocene Geology in Cyrenaican Libya (C.B.M. McBurney and R.W. Hey, Cambridge University Press, 1955) one will find that "external molds of cones" were found in the Wadi Derna, Cyrenaica, tufas (page 295). These impressions when compared with "cones of all species of pine now living in the Mediterranean region, the Near East and temperate Europe" showed that "Pinus halepensis was the only one whose cones showed the same characteristics". In addition, at Ain Mara (Cyrenaica), about 25 kilometers west of Derna, fossil pollen grains of Pinus were excavated from Pleistocene deposits (page, 121 loc. cit.). Charcoal fragments from Hagfet ed Dabba (page, 303, loc. cit.) were examined by Dr. C.R. Metcalf of the Royal Botanic Gardens, Kew, in the United Kingdom, who reported that "most of the samples consisted of one or other of two distinct coniferous woods. One, in which resin canals could be seen, is probably a pine, and might quite well be Pinus halepensis Mill... " Radio-carbon tests place this charcoal and the associated artifacts as being Middle Paleolithic or the earliest Upper Paleolithic, or say, "the fourteenth millennium B.C." (page 234, loc. cit.) I think that we can agree that Pleistocene is sufficiently long ago (somewhere between 75,000 and a million years ago) to qualify P. halepensis (or at any rate a Pinus of some sort even if the evidence of the cone molds is not accepted) for inclusion as an African plant. Even the "fourteenth millenium B.C." in my opinion qualifies Pinus (almost certainly P. halepensis) as an African species! "
![]()
![]()
![]()