![]()
![]()
![]()
2.1 Population statistics
2.2 Wood energy consumption in households
2.3 Wood energy consumption in industry and services
2.4 Destinations outside Phnom Penh
2.5 Consumption of other forms of energy
2.6 Estimates of future domestic consumption
The Kingdom of Cambodia is a poor country with low living standards for the majority of the population. Throughout the country woodfuels are the most widely used sources of energy and contribute 85% of the total energy consumption (including the transport sector) (MIME 1996a). In Phnom Penh 84% of households use firewood and charcoal as their main fuel for cooking (NIS 1997), although some households use agricultural residues and others use LPG. Woodfuels are also used extensively by the industry, handicrafts and services sectors. Firewood and charcoal consumption in Phnom Penh in 1995 was estimated to account for 59% of total energy consumption (excluding transport) (MIME 1996a).
The population of the Kingdom of Cambodia is predominantly a rural one. The Socio Economic Survey of Cambodia (SESC) estimated a national population for 1996 of 10.3 million (NIS, 1997), of which only 8% live in Phnom Penh. The SESC shows an annual national increase of 2.4% between 1994 to 1996. However, urban areas grew much more quickly: Phnom Penh, for example, showed an annual increase of 5.5%.
Due to the loss of records during the 1970s, and the subsequent lack of any population census, statistics from different sources give varying estimates of population for Phnom Penh as follows:
|
- Population register from police statistics, 1993 |
690,928 people |
117,794 families |
|
- Socio-Economic Survey, 1993/4 |
717,300 people |
121,100 families |
|
- Estimates from the Department of Forestry, 1994 |
784,984 people |
139,215 families |
|
- Estimates from the Department of Energy, 1996 |
|
132,000 families |
|
- Socio-Economic Survey, 1996 |
796,936 people |
150,280 families |
This study will adopt the figures from the Socio-Economic Survey 1993/4 and 1996, as these two studies employed similar methodological techniques.
The National Institute of Statistics (1997) gives the following figures for domestic fuel use in Phnom Penh for 1996:
Table 1: Domestic Energy Consumption in Phnom Penh by Main Fuel Used for Cooking
|
Fuel Type |
No. of Households |
No. of People |
Percentage of Households |
|
Firewood |
69,880 |
370,575 |
46.5 |
|
Charcoal |
56,355 |
298,851 |
37.5 |
|
LPG |
14,427 |
76,506 |
9.6 |
|
Kerosene |
7,965 |
42,238 |
5.3 |
|
Electricity |
150 |
797 |
0.2 |
|
Other |
1,503 |
7,969 |
0.9 |
|
Total |
150,280 |
796,936 |
100 |
Source; NIS/ADB, 1997
During the study, people using firewood as their main energy source for cooking gave the following information:
Table 2: Daily Firewood Consumption
|
Place of Interview |
Household Size |
Bundles/Day |
|
Boueng Salang |
6 |
4.5 |
|
Toekloak |
4 |
4 |
|
O'Russei |
5 |
3 |
|
Toul Tom Pong |
5 |
2.17 |
|
Chhbar Ampeou |
9 |
11.66 |
|
Chhbar Ampeou |
4 |
3.67 |
|
Chhbar Ampeou |
5 |
3.3 |
|
Chhbar Ampeou |
12 |
5 |
|
TOTAL |
50 |
37.3 |
This suggests that the average amount of firewood consumed per person is:
37.3 bundles/50 people = 0.75 bundles = 0.00093 steres per day.
According to the National Institute of Statistics (1997), the percentage of households using firewood as their main cooking fuel was 46.5%. This means that 69,880 households in Phnom Penh, or 370,575 people use firewood. Using the consumption figure indicated above, annual demand from households using mainly firewood for cooking is therefore 125,791 steres. The estimated demand by the Department of Energy (MIME, 1996b) for 1997 was 87,356 steres.
During the study, people using charcoal as their main cooking fuel gave the following information:
Table 3: Daily Charcoal Consumption
|
Place of Interview |
Household Size |
Amount Used (kg) |
|
Wat Phnom |
4 |
1.83 |
|
Russei Keo |
4 |
1.83 |
|
Psa Silop |
6 |
1.5 |
|
O'Russei |
6 |
1.33 |
|
Bodeng |
5 |
1.66 |
|
Wat Mohamontrey |
4 |
2.5 |
|
Wat Ko |
6 |
1.83 |
|
Olympic |
4 |
1.17 |
|
Bodeng |
4 |
1.33 |
|
Chhbar Ampeou |
8 |
2.5 |
|
Toul Tom Pong |
5 |
1.83 |
|
TOTAL |
54 |
19.31 |
This total suggests that the average consumption of charcoal per person is:
19.3 kg/54 people = 0.36 kg per day.
In 1996, 56,355 households consisting of 298,851 people or 37% of the population (NIS, 1997), used charcoal as their main cooking fuel. Using the average consumption figure indicated above, the annual consumption is 38,986 tonnes. The estimated annual consumption for 1997 was 21,862 tonnes (MIME, 1996b).
The Department of Energy estimated that in Phnom Penh the service sector would consume 7%, and the industrial sector 12% of the wood energy supplied to the city in 1997 as follows:
|
|
Services |
Industry |
|
Firewood (steres) |
345 |
22,287 |
|
Charcoal (tonnes) |
3,966 |
276 |
Source; MIME, 1996
A full survey of this sector was outside the scope of the Wood Energy Study. However, as it became clear that brick kilns are huge consumers of wood, an overview is given below.
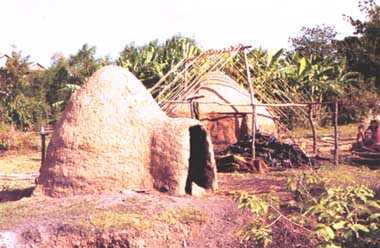
There are many brick and tile kilns operating in Phnom Penh to supply the construction industry. These kilns are usually of the 'boat shaped' variety because they can produce bricks faster than other types of kiln. The brick kilns consume mixed types of firewood, from natural forests, flooded forests, rubber plantations and sawmills, especially Kasotim (at Nhek Leoung) and Kolexim (at Prey Preou). As Phnom Penh has no forest areas all the firewood has to be brought from outside the area.
There are 71 brick kilns in Phnom Penh, 63 in Russei Keo, 4 in Meanchay and 4 in Dangkor. In these 71 kilns, 50% use wood from the natural forests and the others use firewood from sawmills, rubber plantations and flooded forest. Each kiln measuring 2.7m x 16m x 2.7m, consumes 30 steres of wood from natural forests, or 50-60 steres of wood from flooded forests, rubber plantations and sawmills. Each kiln can produce bricks or tiles twice per month, but this depends on the demands of the market, so most kilns produce only once a month. The annual consumption of firewood is therefore:
35 kilns x 30 steres x 12 cycles = 12,600 steres
36 kilns x 55 steres x 12 cycle = 23,760 steresgiving a total of 36,360 steres per year.
Table 4 shows the annual total quantity of firewood consumed in kilns in Phnom Penh to be 51,143 steres.
Table 4: Quantity of Firewood Consumed by Kilns in Phnom Penh
|
Kiln Type |
Number of Kilns |
Average Firewood Use Per Kiln (stere) |
Cycles per Year |
Firewood Use Per Year (stere) |
||||
|
Firewood |
Electric |
Natural Forest |
Other |
Natural Forest |
Other |
Total |
||
|
Brick |
71 |
- |
30 |
55 |
12 |
12,600 |
23,760 |
36,360 |
|
Cake |
39 |
- |
0.5 |
- |
365 |
7,118 |
- |
7,118 |
|
Bread |
30 |
12 |
0.7 |
- |
365 |
7,665 |
- |
7,665 |
|
Total |
140 |
12 |
|
|
|
27,383 |
23,760 |
51,143 |
There are more bakeries in Phnom Penh than in other provinces in the Kingdom of Cambodia. Bakeries are of 2 types:
· Cake Bakeries
There are 39 of this type which use small ovens, and the average consumption of firewood for each is 0.5 steres per day. Firewood used is purchased from stores in Phnom Penh. The annual consumption of firewood is:
39 bakeries x 0.5 steres x 365 days = 7,118 steres.
· Bread Bakeries
There are 42 bakeries in Phnom Penh of which 12 are powered by electricity and 30 by firewood. Bakeries have the capacity to produce many times each day, but for this study a production of 1 cycle per day was used. The annual consumption of firewood is:
30 bakeries x 0.7 steres x 365 days = 7,665 steres.
The study showed Phnom Penh to be developing as a trading centre for woodfuels consumed in Kandal, Prey Veng and Svay Reing (see Table 5).
According to the study, there are 13 firewood stores in Takhmao town, which sell on average:
26 bundles x 13 stores x 365 days = 123,370 bundles or 155 steres per year.
Information from other sections of the study shows that:
3,285 steres are transported annually from Kampong Speu
4,015 steres are transported annually from Pochentong
155 steres are transported annually from other depots in Phnom Penh.
Takhmao
According to the study at Takhmao, one depot among 13 purchases from Phnom Penh, and the other 12 depots from Chhbar Ampeou. The average quantity of charcoal purchased from Phnom Penh per year is:
1 sack x 365 days = 365 sacks = 20 tonnes
The quantity of charcoal purchased from Chhbar Ampeou per year is:
3.67 sacks x 12 depots x 365 days = 16,075 sacks = 965 tonnes
The total quantity sold in Takhmao each year is:
16,440 sacks = 985 tonnes.
Nhek Leoung
The study showed that at Nhek Leoung, there are 12 charcoal depots on the eastern bank of the river, of which one purchases charcoal from Chhbar Ampeou. The average annual purchase of this depot is:
5.33 sacks x 365 days = 1,945 sacks = 117 tonnes
There are an additional 6 charcoal depots in the western part of Nhek Leoung which purchase charcoal from Chhbar Ampeou, and their annual purchases total:
0.61 x 6 depots x 365 days = 1,336 sacks = 80 tonnes.
Therefore, the total quantity of charcoal transported annually to Nhek Leoung is:
1,945 sacks + 1,336 sacks = 3,281 sacks = 197 tonnes.
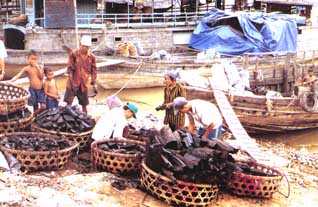
Table 5: Wood Energy Traded Through Phnom Penh
|
Location |
Quantity of Firewood |
Quantity of Charcoal |
||||
|
stere/day |
stere/month |
stere/year |
ton/day |
ton/month |
ton/year |
|
|
Takhmao |
20.4 |
621 |
7,455 |
2.70 |
82 |
984 |
|
Nhek Leoung |
- |
- |
- |
0.54 |
16 |
197 |
|
TOTAL |
20.4 |
621 |
7,455 |
3.24 |
97 |
1,181 |
2.5.1 Liquid petroleum gas (LPG)
2.5.2 Consumption of agricultural residues
As the country improves its economy, the population and their living standards are likely to increase, especially in Phnom Penh. Raised incomes will allow some households to switch to LPG for cooking. LPG is also increasingly used by services such as restaurants. All LPG is imported into Cambodia, by three companies:
· Cambodia Gas Company who import from Thailand
· Uni Gas Company who import from Thailand
· Mittapheap Gas Company who import from Vietnam
It was found that these companies sell to depots in Phnom Penh for resale, so it was not possible to determine the amount sold for domestic use only. Overall, their monthly sales are:
· Cambodia Gas Company -100 tonnes
· Uni Gas Company -130 tonnes
· Mittapheap Gas Company -120 tonnes
This gives a total of 350 tonnes per month, or 4,200 tonnes per year. As the study reached finalisation, another company, Totalgaz, began trading in Phnom Penh.
· Household LPG Consumption
According to the study, people using LPG gave the following information:
Table 6: Monthly LPG Consumption
|
Name of Family |
Household Size |
Amount Used per Month (kg) |
|
Psa Thmei trader |
7 |
15 |
|
O'Russei trader |
6 |
13 |
|
Ing Thoeng |
12 |
23 |
|
Chea Sophea |
7 |
30 |
|
Soum Bunthein |
5 |
15 |
|
So Somali |
11 |
27 |
|
Hang Bannak |
5 |
15 |
|
Kim Seng |
10 |
24 |
|
Ouk Heil |
4 |
12 |
|
TOTAL |
67 |
174 |
The average amount of LPG consumed by each person is:
174 kg/30 days x 1/67 people = 0.0865 kg per day
In 1996, 14,427 households (9.6%), or 76,506 people used LPG as their main cooking fuel (NIS 1997). Using the consumption figures above, this implies an annual consumption of 2,417 tonnes. This figure is quite close to the Department of Energy's 1997 estimate of 2,276 tonnes (MIME, 1996b).
· Industrial and Service Sector LPG Demand
The Department of Energy gives the following figures for LPG consumption in 1997:
|
|
Terajoules |
Tonnes |
|
Services |
118 |
2,607 |
|
Industry |
0 |
0 |
In Cambodia, the majority of the population are farmers, and their products provide important supplies for the people of Phnom Penh. Phnom Penh generates a lot of waste, although some can be used as fuel, such as coconut husk, crushed sugar cane (bagasse), rice husks etc. Some households in Bakheng use these fuels. In other areas, sellers of sugar cane, rice and sweetcorn keep the waste for their own domestic use. Some people use sawdust from sawmills and wood processing companies for domestic use.
A comparison of energy demand forecasts by MIME and those based on more recent NIS figures illustrate the difficulties involved in planning for future energy demand, particularly in the absence of past consumption and population growth trends. The figures shown in Table 7 relate to households using a particular energy source as their main form of energy for cooking. In reality however, most households use more than one form of energy, so the figures are likely to be underestimated.
The table shows that in 1996, the estimated demand by households was approximately 87,816 steres of firewood and 21,310 tonnes of charcoal per year (MIME). In comparison, the wood energy flow study shows approximately 125,792 steres of firewood and 39,006 tonnes of charcoal. A comparison of forecasts for 1998, also shows different figures. Those of MIME are based on a per capita daily consumption of 0.37 kg for firewood and 0.196 kg for charcoal. Forecasts by the WFFS team, based on the household breakdown from NIS (1997) and from the study findings, use a per capita daily consumption of 0.56 kg for firewood and 0.36 kg charcoal.
Based on NIS (1995) data, MIME forecasted a population growth rate of 4.4% per year, with a constant household size of 5.923. In fact, the population grew at 11.1% over the 2 year period to 1996, and household size reduced from 5.9 to 5.3 (NIS, 1997).
Table 7 shows that the demand for firewood is decreasing but demands for charcoal, LPG and kerosene are increasing. The wood energy study found an energy transition from woodfuels to LPG by wealthier households, but the above figures also suggest a transition from firewood to charcoal, which indicates that the demand for wood energy will continue into the future.
Table 7: Estimated Annual Domestic Energy Consumption
|
Year |
Source |
Firewood |
Charcoal |
Gas |
Kerosene |
Other |
|
|
(stere) |
(ton) |
(ton) |
(ton) |
|
|||
|
1994
|
MIME/ADB |
Number of People |
388,777 |
290,507 |
19,367 |
12,911 |
5,738 |
|
Annual Consumption |
88,391 |
20,724 |
663 |
3,258 |
- |
||
|
Percentage of Households |
54.2 |
40.5 |
2.7 |
1.8 |
0.8 |
||
|
NIS/WFFS |
Number of People |
388,777 |
290,507 |
19,367 |
12,911 |
5,738 |
|
|
Annual Consumption |
131,970 |
37,917 |
612 |
1,099 |
- |
||
|
Percentage of Households |
54.2 |
40.5 |
2.7 |
1.8 |
0.8 |
||
|
1996
|
MIME/ADB |
Number of People |
387,090 |
308,108 |
48,484 |
14,858 |
23,460 |
|
Annual Consumption |
87,816 |
21,310 |
1,657 |
3,598 |
- |
||
|
Percentage of Households |
49.5 |
39.4 |
6.2 |
1.9 |
3.0 |
||
|
NIS/WFFS |
Number of People |
370,575 |
298,851 |
76,506 |
42,238 |
8,766 |
|
|
Annual Consumption |
125,792 |
39,006 |
2,417 |
3,597 |
- |
||
|
Percentage of Households |
46.5 |
37.5 |
9.6 |
5.3 |
1.1 |
||
|
MIME/ADB |
Change in Energy Use (%) |
-4.7 |
-0.6 |
3.5 |
0.1 |
1.7 |
|
|
NIS/WFFS |
Change in Energy Use (%) |
-7.7 |
-3.0 |
6.9 |
3.5 |
0.3 |
|
|
1998
|
MIME/ADB |
Number of People |
384,252 |
326,316 |
86,052 |
17,040 |
38,340 |
|
Annual Consumption |
86,897 |
22,448 |
2,916 |
3,853 |
- |
||
|
Percentage of Households |
45.1 |
38.3 |
10.1 |
2.0 |
4.5 |
||
|
NIS/WFFS |
Number of People |
343,534 |
305,462 |
146,090 |
77,915 |
12,395 |
|
|
Annual Consumption |
116,613 |
39,869 |
4,616 |
6,635 |
- |
||
|
Percentage of Households |
38.8 |
34.5 |
16.5 |
8.8 |
1.4 |
||
Notes:
· MIME/ADB: Energy Demand Forecasts (MIME, 1996b)· NIS: Population figures and percentage of households using energy types
· WFFS: Calculations of annual consumption based on NIS figures and the findings of this study related to per capita consumption.
The figures shown in the table give different information from different sources, which highlights the need for a good information base which can be continually and consistently updated for energy planning.
![]()
![]()
![]()