![]()
![]()
![]()
The Family Income and Expenditure Survey (FIES, Kakei Chosa Nenpo), conducted by the Statistics Bureau of the Management and Coordination Agency, is one of two comprehensive consumer expenditure surveys in Japan.[1] Its purposes are to create consumer price indices and to collect information on household income and expenditure for policy planning purposes.
The survey covers households designated as appropriate households by the Statistics Bureau. Appropriate households include all households except those engaged in agriculture, forestry and fishery, and one-person households.[2] In the 1990 population census, there were about 29 million appropriate households (71.3 percent of the total 40.67 million households). From these, sample households were chosen by a stratified three-stage sampling method.
The FIES surveys about 8 000 households each month. Each household participates in the survey for a period of six consecutive months, and one-sixth of the participating households are replaced by new ones each month. Unlike the United States' Consumer Expenditure Survey (CES),[3] the Statistics Bureau of Japan does not release household identification numbers; it is therefore not possible to track individual households throughout a survey period. At the beginning of the survey period, data on household characteristics are collected, such as household composition, total annual household income and housing tenure. Then, twice a month for the following six months, each household is asked to report its expenditure on and the amount purchased of each of the survey commodities.
One of the recent trends in Japanese household food consumption patterns is "Westernization". Table 2.1 shows how the quantities of major food commodities purchased in Japan changed between 1975 and 1997. It is noticeable that purchases of traditional Japanese foods have tended to decrease in quantity over the last 30 years, while purchases of non-traditional goods have increased.
TABLE 2.1
Changes in quantities purchased:
1970-1995
|
Decrease |
Neutral |
Increase |
||
|
Cereal |
Oil/fats |
Meat |
6% |
|
|
Non-glutinous rice |
-50% |
|
Beef |
41% |
|
Fish |
-24% |
|
Pork |
-13% |
|
Fresh vegetables |
-24% |
|
Poultry |
8% |
|
Fresh fruits |
-45% |
|
Ground beef |
19% |
|
Processed vegetables |
|
|
Dairy |
|
|
Dried mushrooms |
-60% |
|
Milk |
20% |
|
Bean curd |
-10% |
|
Non-alcoholic beverages |
|
|
Pickled radishes |
-46% |
|
Black Tea |
13% |
|
Non-alcoholic beverages |
|
|
Coffee |
143% |
|
Green tea |
-33% |
|
|
|
Source: FIES, various issues.
The characteristics of Japanese household food expenditure patterns can be compared with those of United States patterns, which may be considered a typical Western country. The statistics and graphs in this report are based on the following tables: Table 17 in the FIES 1997 Annual Report, published by the Japanese Statistics Bureau; and the tables on pages 71 and 72 of the 1997 CES Codebook, provided by the United States Bureau of Labor Statistics.[4]
The characteristics of households in the FIES reflect Japan's rapidly ageing population. Compared with the United States survey, in 1997:
the average reference person in Japan was older (51.6 years of age, compared with 47.7 years in the United States);
a higher percentage of households in Japan included children under 18 years of age (0.78 percent, compared with 0.69 percent in the United States);
the percentage of households with at least one member over 65 years of age was also higher in Japan (0.47 percent, compared with 0.31 percent in the United States);
the average household in Japan was larger (3.34 members, compared with 2.54 in the United States);
the average household in Japan had more wage earners, (1.54 earners, compared with 1.41 in the United States);
more Japanese households had housing tenure (72.4 percent, compared with 61.4 percent in the United States);
average household disposable income was higher in Japan (497 036 yen - or US$4 082 - per month, compared with US$3 160 in the United States);
the saving rate per household was higher in Japan (28 percent, compared with 6.9 percent in the United States).
Figure 2.1: Food expenditure shares in Japan in 1997
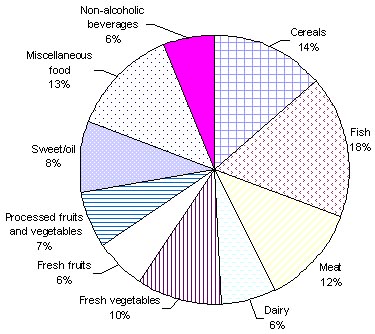
Source: FIES, 1997.
Figure 2.2: Food expenditure shares in the United States in 1997
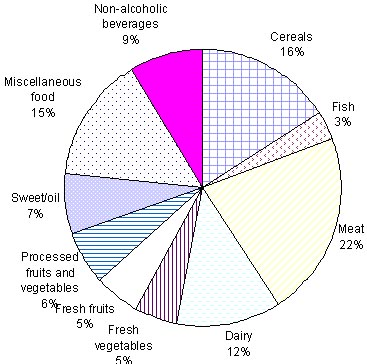
Source: CES, 1997.
Figures 2.1 and 2.2 show the food expenditure shares of ten aggregate food groups for home consumption in Japan and the United States, respectively. The expenditure share for cereals in 1997 was almost the same in the two countries. However, while about 50 percent of Japan's cereal expenditure was on rice, the United States' rice expenditure was negligible. Total expenditure shares of meat and fish were about the same in both countries, but the ratios of meat to fish expenditures were significantly different. The shares of fish and vegetables were significantly higher in Japan, while the shares of fresh fruits were almost the same in both countries. The expenditure shares of processed fruits and vegetables were also about the same; but 95 percent of this expenditure in Japan was for processed vegetables, while only 40 percent was in the United States. The dairy product share was significantly lower in Japan. Other products, such as miscellaneous foods and non-alcoholic beverages, had almost the same share levels in both countries. Combining these results, the following general observations can be made regarding the food consumption patterns of the two countries:
Foods that had a significantly higher expenditure share in Japan than in the United States have decreased their shares over time in Japan.
Foods that had a lower share in Japan than in the United States have increased their shares over time in Japan.
As a result, for some foods, the differences in expenditure shares between the two countries have declined in recent years.
In summary, although the Westernization of Japanese food consumption patterns can be observed, there still seems to be a wide gap between the expenditure patterns of Japanese and United States households. However, it should also be noted that differences in expenditure share reflect differences in relative food prices, as well as differences in the quantities consumed. Therefore, the actual food demand structures of Japan and the United States may not be as diverse as they appear from the observed expenditure share patterns, especially those for fish and meat, which are relatively expensive food groups. Another significant difference is in the expenditure share for food away from home (FAFH) (excluding alcoholic beverages), which was 18.7 percent in Japan and 29.9 percent in the United States.
This report also uses some other important characteristics of the survey data. First, there is the issue of seasonality. From monthly data, it can be observed that December is irregular in terms of both expenditures and income. In particular, food expenditure in December is significantly higher than in other months, apparently owing to preparations for the New Year feast. Second, there are regional differences. Total household income and expenditures tend to be higher in Kanto and lower in Hokkaido and Okinawa. More on these characteristics will be discussed in later sections of the report.
Although the original survey covered in detail all of the commodities that each household purchased, the data used in this report have been aggregated according to food categories and household characteristics. Data on detailed food categories, except for FAFH, include expenditures and quantities purchased. For FAFH and other non-food categories, data on the quantities purchased are not available.
The FIES data set for 1997 covered a total sample of 95 223 households. As already noted, these households had at least two persons. In order to understand Japanese food consumption patterns fully, it is necessary to study the differences among demographic groups. Among the most important demographic variables are age, household size and the number of wage earners. Income is often used as a demographic variable in descriptive analysis. Based on these demographic variables, the distributions of the sample and mean statistics are shown in Annexes A (Table A.1), B (Table B.1) and C (Table C.1).
Annexes A, B and C present descriptive statistics for the daily household consumption of various foods or food groups by income, age, household size and number of wage earners. The descriptive analysis focuses on income-consumption relationships. Tables show the comparisons of average prices paid by households in different demographic groups.
Several important findings can be drawn from these descriptive statistics. As shown in Table A.7, household rice consumption showed a strong positive relationship with income for all age groups, especially for the middle-aged (35 to 44 years) and elderly (more than 65 years) groups. Households in the highest-income group showed some declines in rice consumption. Overall, household daily consumption of rice in 1997 varied from 258.19 g for the lowest-income group to 309.34 g for the highest-income group.
Table A.8 shows per capita rice consumption by age and income. The relationship between per capita rice consumption and income is far less clear than it is for household rice consumption. Except for in the older group, per capita rice consumption tends to fluctuate over the various income levels. This pattern is not unreasonable because many other factors affect per capita rice consumption, for example, household size - as shown in Table B.7. For a household of four members, the per capita consumption of rice steadily increases over income levels, from 66.57 g/day for the lowest-income group to 81.94 g/day for the highest-income group. These descriptive statistics provide clear evidence that rice is not an inferior good in Japan. Furthermore, it should be noted that, even if the descriptive data were to show strong negative relationships between rice consumption and income, it cannot be assumed that rice is an inferior good; for example, per capita beef consumption in the United States declined steadily during the 1980s and 1990s, but no economist claimed that beef was therefore an inferior good in the United States.
Another important finding from the descriptive statistics is that there are strong positive relationships between price and income for many foods in Japan. Table A.16 shows these relationships by age groups. Higher-income households pay higher prices for rice than lower-income households do, and the oldest age group pay higher prices for rice in every income level. It may therefore be reasonable to assume that higher-income and older households tend to buy higher-quality rice than lower-income and younger households. Although the survey did not provide information about the quality of rice purchased by households, it may be possible to investigate the demand for different qualities of rice by estimating the demand function for separate income and/or age groups.
Analysis of the price data for beef shows a very similar pattern of positive relationships between price and income. As shown in Table A.18, higher-income households pay higher prices for beef than lower-income households do. Interestingly, the oldest group also pay far higher prices for beef in every income level. These statistics provide a basis for modelling the demands for different qualities of beef by separating the total sample into income and age subgroups.
One of the major econometric problems in modelling demand using household data is that many households do not purchase various foods during the survey period. Tables 2.2 and 2.3 show the percentages of households with zero consumption.
The problem of missing price data is related to zero consumption. As households with zero consumption provide no information on either expenditures or quantities, no unit values (prices) can be derived for these households. The price used for estimation in this study was obtained by dividing expenditure by quantity purchased. The zero consumption problem poses a serious estimation flaw, as there are no price data for households with zero consumption. In order to obtain price data for these households, it was assumed that each household faces the mean price of each commodity for its respective region, month and income. There are ten regions, five income levels and twelve months, hence a total of 600 average prices for the sample. Households with missing price data are assumed to face the average prices for their income level and region and the month of the survey. FAFH does not have a quantity unit, so the Consumer Price Index (CPI) from the Annual Report on the Consumer Price Index (published by the Statistics Bureau of the Management and Coordination Agency) was used for FAFH. The CPI for FAFH has only monthly variations so, within each month, all households have the same CPI for FAFH.
TABLE 2.2
Percentages of households with zero
consumption, 11 major commodities
|
Food variables |
% |
|
Non-glutinous rice |
43.75% |
|
Bread |
4.15% |
|
Noodle |
6.14% |
|
Fresh fish and shell fish |
2.45% |
|
Fresh meat |
1.92% |
|
Milk |
8.36% |
|
Eggs |
5.51% |
|
Fresh vegetables |
0.24% |
|
Fresh fruits |
5.50% |
|
Fats and oil |
42.12% |
|
FAFH |
12.65% |
Source: FIES, 1997.
TABLE 2.3
Percentage of households with zero
consumption, seven meat products
|
Food variables |
% |
|
Beef |
20.63% |
|
Pork |
9.50% |
|
Poultry |
19.67% |
|
Ground meat |
70.37% |
|
Ham |
39.29% |
|
Sausage |
33.39% |
|
Bacon |
59.21% |
Source: FIES, 1997.
|
[1] The other survey, the
National Survey of Family Income and Expenditure (NSFIE, "Zenkoku Shohi
Jittai Chosa"), is conducted by the same agency every five years. Its sample
size is 60 000 households, including single-person households. It covers ten
aggregate expenditure categories, but no detailed food categories. [2] The number of one-person households in Japan increased by 19.7 percent from 1990 to 1995, and is still increasing. At 11.24 million, they accounted for 25.6 percent of all households in the 1995 census. These increases are caused by a growing number of young single people setting up their own households rather than staying in the parental home until marriage, and a growing number of elderly people who live alone rather than joining their children's households as part of the extended family. Thus, the distribution of one-person households is V-shaped. Responding to this increase, in January 1995, the Statistics Bureau started to conduct a monthly survey called The Income and Expenditure Survey for One-Person Households (IES). Several characteristics of one-person households can be noted (the following statistics were taken from the 1998 IES): the average age of the reference person is younger (48.6 years) than in the FIES; about half of the sample is female; of these 50 percent are more than 60 years of age; the male sample is biased towards the younger generation; about 60 percent of households are workers' households; only the average income for workers' households is obtained (283 443 yen per month); the saving rate is slightly higher (29.2 percent) than in the FIES; and housing costs are the only expenditure for which one-person households spend more than the nominal level for average household in the FIES. One-person households differ greatly from their corresponding sex and age groups in the FIES in terms of their consumption of food outside the home and prepared food - one-person households are the major consumers of those goods. [3] The CES is a representative consumer survey in the United States and is conducted by the Bureau of Labor Statistics. It consists of two independent surveys: the CES Dairy Survey, which has characteristics similar to those of the FIES; and the CES Interview Survey, which is more like the NSFIE. [4] In this report, data from the CES Dairy Survey are used. Note that the CES includes one-person households. |
![]()
![]()
![]()