![]()
![]()
![]()
Nick Bajjalieh, Ph.D.
President, Integrative
Nutrition, Inc., Decatur, IL USA
INTRODUCTION
The animal production industry provides for one of the most basic of human needs, quality food proteins. It does so through a synergistic relationship with other segments of agriculture. One such segment is that devoted to oilseed production and processing. Through this relationship, both segments complement, and to a certain extent enable, the economic sustainability of one another. Understanding this mutually beneficial relationship, in addition to applied nutritional considerations, is critical to any evaluation of the role oilseeds play in animal production.
The animal feed industry productively utilizes the co-products associated with the refining of oilseeds into higher value food materials. In so doing, it contributes value to the value-chain segment, which produces the ‘by-product’. In some cases, the incremental economic value contributed through utilization of the by-product may be a deciding factor in the economic viability of the value chain segment.
Through its use of such materials, the animal production industry benefits humankind in at least two additional ways. The most obvious being the relatively economical production of quality animal proteins and other products for human consumption. In addition, by serving as an outlet for such by-products, the animal production industry prevents their introduction into the environment in what might be less useful ways.
Understanding where one is starting from is critical to any journey forward. Therefore, any rational evaluation of the future for oilseed proteins must be grounded in the present. The first portion of this presentation seeks to briefly review and summarize the present. The second portion addresses some issues relative to moving forward.
OILSEED PRODUCTION
World production estimates for the major oilseed crops are presented in Table 1:
TABLE 1
World oilseed production (USDA Estimates, April
2002)
|
Oilseed |
Preliminary 2000/2001 |
|
|
Million tonnes |
% of total |
|
|
Soybeans |
175.21 |
56.0 |
|
Cottonseed |
33.5 |
10.7 |
|
Peanut |
31.1 |
9.9 |
|
Sunflower seed |
23.24 |
7.4 |
|
Rapeseed |
37.5 |
12.0 |
|
Copra |
5.73 |
1.8 |
|
Palm Kernel |
6.87 |
2.2 |
|
Total |
313.15 |
|
In terms of gross production, soybeans are the dominant oilseed crop. More tonnes of soybeans are produced globally than all other major oilseeds combined.
OILSEED USAGE
The proteins in oilseeds can be fed either as part of the oil-intact seed, or as a meal from which the oil has been removed.
A relatively small proportion of oilseed production is fed to animals as the whole seed. There are both economic and nutritional reasons why this is the case. Depending upon the specific oilseed involved, and the type of animal being fed, special considerations must be addressed when feeding whole oilseeds.
One consideration is the presence of naturally occurring toxic compounds such as the gossypol pigment present in cottonseed. While whole cottonseed should not be fed to non-ruminant animals, it can be fed to ruminants when appropriate limits are employed. Rapeseed contains erucic acid as well as glucosinolates, which are goitrogenic compounds. Canadian plant breeders have developed rapeseed cultivars significantly lower in both of these compounds. Oilseed and products derived from such cultivars are referred to as Canola. Soybeans contain ‘anti-nutritional’ factors which must be denatured through some form of heat treatment prior to feeding to non-ruminant animals.
A nutritional consideration is the caloric density of oilseeds. As is further discussed later, modern feed formulation seeks to optimize the levels and balance between energy, protein/amino acids, essential fatty acids, minerals and vitamins in the context of a given animal’s needs. Fats contain approximately 2.25 times the energy of carbohydrate. Due to their high oil content, oilseeds tend to be relatively high in nutritional energy. This can be an advantage in feed formulations which require ingredients that provide higher levels of energy. However, energy also serves as a ‘cap’ on the usage of whole oilseeds.
Another nutritional consideration is the fatty acid profile of the oil. The impact of feeding unsaturated fats on various non-ruminant animal carcass characteristics is a concern in many production situations. However, the major consideration in the feeding of whole oilseeds is economic. Historically, the value of the oil from oilseeds is greater when it is made available to the human food market than when it is retained in the whole seed and fed as a source of energy in animal feeds. As a result, the vast majority of oilseed is processed into oil and meal.
OILSEED PROCESSING
In its simplest form, oilseed processing is involved with the separation of oil from non-oil oilseed constituents. Different approaches to this objective exist, the detailed discussion of which is beyond the scope of this paper. However, a simplified schematic of the primary steps is presented in Figure 1.
Historically, the major focus of oilseed processing has been the extraction of high quality oil. The meal and other co-products were typically regarded as ‘by-products’ and thus of lesser interest.
Figure 1. Oilseed processing - a simplified schematic
Processing considerations do have a direct impact on the nutritional value of oilseed meals. Some positive, others negative. As an example, the primary anti-nutritional factors in soybean meal need to be deactivated by the proper use of heat. If too much heat is applied, the protein can be damaged to the extent that it becomes less digestible when fed to the animal. Over the course of time, market pressures have required an increasing focus on meal quality. This trend is expected to continue.
OILSEED MEAL CONSUMPTION
A United States Department of Agriculture (USDA) estimate of meal usage for the major oilseeds is presented in Table 2. Of note is the expanded dominance of soybean’s meal relative to the meals from other oilseeds. With the exception of cottonseed, this is partially a reflection of the lower oil content of soybeans relative to the other major oilseeds. Other applications, such as the direct feeding of cottonseed to ruminant animals and human food applications for whole peanuts are also factors.
TABLE 2
World oilseed meal consumption (USDA Estimates,
April 2002)
|
Oilseed |
Preliminary estimates, 2000/2002 |
|
|
Million tonnes |
% of total |
|
|
Soybean |
118.51 |
69.2 |
|
Cottonseed |
11.25 |
6.6 |
|
Peanut |
5.45 |
3.2 |
|
Sunflower seed |
9.6 |
5.6 |
|
Rapeseed |
21.08 |
12.3 |
|
Copra |
2.07 |
1.2 |
|
Palm Kernel |
3.39 |
2.0 |
|
Total |
171.35 |
|
The economic relationship between oil and meal is a critical consideration relative to both meal availability and the emphasis placed on improving meal quality. The two primary products of oilseed processing are fed into two different markets:
1. Human foods for oil
2. Animal food for meal.
At a given point in time, each has its own unique supply/demand dynamic. Yet, they are linked.
Since oil and meal are linked in the context of the oilseed from which they are derived, production of one requires production of the other. As a result, a demand driven increase in the production of one component is associated with increased market availability of the other.
Both oil and meal are relatively perishable. This, together with the capital value they represent, makes long-term storage of either undesirable. As a result, increased supplies are priced to achieve usage by the market. Where severe price-cutting is required to ‘move’ either oil or meal, this decreases the net return associated with processing the oilseed. Since whole oilseed can be stored under proper conditions for longer periods, the alternative to a ‘low’ net-value market is to limit the processing of oilseed. (On the other hand, buy it at a lower price.)
Such a balancing act is an ongoing aspect in the decision making process associated with this type of business. For oilseeds in which oil represents the major portion of value, ‘dumping’ meal into the market is less of a concern than for those in which the meal represents a major contributor of value. Such oilseed meals are more prone to fluctuations in availability and price. Also, investing in meal quality aspects is of a lower priority. All of these factors have a significant impact on their use as an animal feed.
Table 3 attempts to lend perspective to this issue. It utilizes USDA estimates for the average value of meal and oil for the oilseed crops presented. Values for meal are the product of meal value per tonne and meal consumption values from Table 2. Values for oil are a product of the respective oil values per tonne and the amount of oil estimated to be associated with the amount of meal consumed.
TABLE 3
Economic value estimates for meal and oil
(2000/2001 crop year)
|
Oilseed |
Average US Dollars per tonne* |
US Dollars for 2000/2001 crop year |
||||||
|
Meal |
Oil |
Total US$ value ($ Million) |
||||||
|
$/t |
Basis** |
$/t |
Basis |
Meal |
Oil |
Meal + |
Meal/ |
|
|
Soybean |
191 |
1 |
311 |
1 |
22 635 |
8 846 |
31 481 |
71.9 |
|
Cottonseed |
158 |
1 |
352 |
1 |
1 778 |
1 426 |
3 203 |
55.5 |
|
Peanut |
134 |
1 |
768 |
1 |
730 |
3 143 |
3 873 |
18.9 |
|
Sunflower |
100 |
1 |
350 |
1 |
960 |
2 620 |
3 580 |
26.8 |
|
seed |
141 |
2 |
372 |
3 |
2 972 |
5 051 |
8 023 |
37.0 |
|
Rapeseed |
92 |
3 |
323 |
3 |
190 |
1 229 |
1420 |
13.4 |
|
Copra |
NA |
|
|
|
|
|
|
|
|
Palm Kernel |
|
|
235 |
4 |
|
5 661 |
5 661 |
|
|
Palm |
|
|
|
|
|
|
|
|
|
Total/Mean |
29 266 |
27 975 |
57 241 |
51.1 |
||||
* USDA: Oilseeds World Markets and Trade, April 2002 Average Prices Oct 2000 to Sept 2001
** Location Basis for Pricing: 1 = US, 2 = Hamburg, 3 = Rotterdam, 4 = Malaysia
It is acknowledged that pricing is highly dependent upon location, specific market conditions at a given point in time and a host of other factors. Also, meal and oil volumes are estimates. Therefore, values are presented only to develop a general, ‘snap-shot’ perspective of the oil to meal by crop relationship.
The gross product value (i.e. meal + oil) of the global soybean crop, relative to that for other oilseeds, is striking. Of the major oilseed meals, soybean meal has the highest average price per tonne. This, together with its high level of consumption results in soybean meal representing 77 percent of the total market value of oilseed meals in the context of the above estimates.
The above testifies to the dominant economic position of soybean meal in the global market for oilseed protein meals. Its higher average market value per tonne reflects its greater inherent value to the animal production industry in general. For these reasons, soybean meal is the ‘standard’ to which other sources of protein and amino acids must be compared.
NUTRITIONAL CONSIDERATIONS
Modern feed formulation seeks to address an animal’s nutritional need in the most efficient manner. A major challenge is the identification of the true nutritional needs of an animal in light of the fact that they are constantly subject to change. Age, genetic background, environment, health status, type and stage of animal production are all factors in determining an animal’s true nutritional needs. Each nutritionist, based upon their own unique set of experiences and in conjunction with the business goals of their own company, develops and constantly re-evaluates his/her vision of what these are.
Once a given set of nutritional needs is defined, the next challenge is to match these needs using ingredients, which complement the nutritional deficiencies of one another. Cereal grains, typically serve as the basis upon which most production animal feeding programmes are based. Cereal grains are typically deficient in many of the nutrients required by an animal. Figure 2 illustrates the extent to which corn (maize) supplies the amino acid needs of a growing broiler chicken.
The heavy horizontal line identifies 100 percent of the requirement. In addition to the above amino acids, corn is also deficient in other nutrients, including vitamins and minerals.
Figure 3 illustrates the combined use of soybean meal, liquid fat, crystalline lysine, methionine and supplemental sources of vitamins and minerals to achieve a nutritionally balanced diet. (The vitamin and mineral supplements are not identified but represent the void between the top of the first column and 100 percent). The different coloured portions of each bar graph represent the relative contribution of the ingredient it represents.
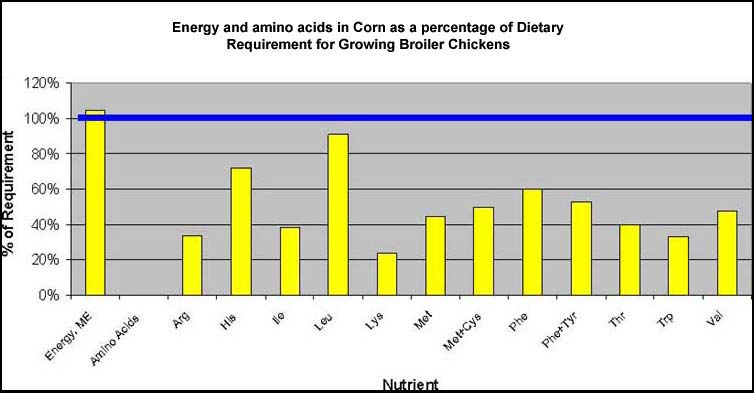
Figure 2. Energy and amino acids in corn as a percentage of dietary requirement for growing broiler chickens
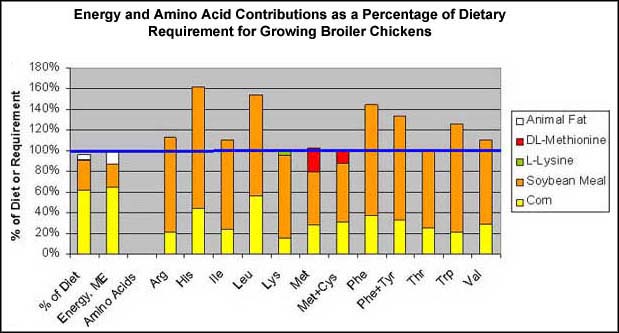
Figure 3. Energy and amino acid contributions as a percentage of dietary requirements for growing broiler chickens
It should be noted that to meet the minimum requirements for some amino acids, others are added in excess. Those essential amino acids at or near 100 percent of requirement tend to be most limiting from a practical formulation perspective. In this example, they are Lysine, the sulphur bearing amino acids Methionine + Cystine and Threonine.
In practical, corn based poultry feed formulations, these same amino acids tend also to be most limiting, but for swine, whose nutritional requirement for the sulphur amino acids is lower, these deficiencies tend to be less of a problem. Those amino acids, which tend to be most limiting are of primary interest when evaluating different sources of protein in the context of similar feeding situations.
Table 4 presents and allows for the comparison of certain major nutrient levels between the different oilseeds. These values are from National Research Council publications (1994, 1998) for poultry and swine. It should be noted that as one compares values across different sources of such information, they often vary. Such differences are a function of both actual compositional variation inherent in the materials and analytical variation across laboratories.
Proteins must be evaluated within the context in which they will be used. Specifically:
what are the nutrient targets for the final feed?
what type of grain serves as the base-mix ingredient?
what other sources of protein and amino acids will be utilized?
When soybean meal is evaluated and compared with canola and sunflower meals in the context of those amino acids which tend to be most limiting, it is, with the exception of its sulphur bearing amino acids, typically superior. In general, soybean meal also tends to be higher in energy than the other protein meals. This is of particular importance in feeding situations where higher nutrient densities are desirable.
In Table 6 amino acids are expressed as a percentage of protein. This format allows for an evaluation of the ‘quality’ of each protein relative to the amino acids of practical interest.
TABLE 4
Selected ‘book’ values for solvent
extracted oilseed meals* (as fed basis, solvent extracted, without hulls [where
applicable])
|
Component(s) |
Unit |
Soybean meal |
Cottonseed |
Peanut |
Sunflower seed |
Canola |
Coconut |
|
Dry matter |
% |
90 |
90 |
92 |
93 |
90 |
92 |
|
Crude fat |
% |
3 |
1.5 |
1.2 |
2.9 |
3.5 |
3 |
|
Non dietary fibre |
% |
8.9 |
28.4 |
16.2 |
27.8 |
21.2 |
51.3 |
|
Energy |
|
|
|
|
|
|
|
|
Swine ME |
kcal/kg |
3 380 |
2 315 |
3 245 |
2 735 |
2 640 |
2 565 |
|
Swine NE |
kcal/kg |
2 020 |
1 325 |
2 170 |
1 635 |
1 610 |
1 695 |
|
Poultry ME** |
kcal/kg |
2 440 |
2 400 |
2 200 |
2 320 |
2 000 |
1 525 |
|
Crude protein |
|
47.5 |
41.4 |
49.1 |
42.2 |
35.6 |
21.9 |
|
Arginine |
% |
3.48 |
4.55 |
5.09 |
2.93 |
2.21 |
2.38 |
|
Histidine |
% |
1.28 |
1.17 |
1.06 |
0.92 |
0.96 |
0.39 |
|
Isoleucine |
% |
2.16 |
1.3 |
1.78 |
1.44 |
1.43 |
0.75 |
|
Leucine |
% |
3.66 |
2.47 |
2.83 |
2.31 |
2.58 |
1.36 |
|
Lysine |
% |
3.02 |
1.72 |
1.66 |
1.2 |
2.08 |
0.58 |
|
Methionine |
% |
0.67 |
0.67 |
0.52 |
0.82 |
0.74 |
0.35 |
|
Methionine + Cystine |
% |
1.41 |
1.37 |
1.21 |
1.48 |
1.65 |
0.64 |
|
Phenylalanine |
% |
2.39 |
2.2 |
2.35 |
1.66 |
1.43 |
0.84 |
|
Phenylalanine + Tyrosine |
% |
4.21 |
3.42 |
4.15 |
2.69 |
2.56 |
1.42 |
|
Threonine |
% |
1.85 |
1.36 |
1.27 |
1.33 |
1.59 |
0.67 |
|
Tryptophan |
% |
0.65 |
0.48 |
0.48 |
0.44 |
0.45 |
0.19 |
|
Valine |
% |
2.27 |
1.78 |
1.98 |
1.74 |
1.82 |
1.07 |
* National Research Council, 1998
** National Research Council, 1994
For ease of comparison across oilseed meals, the above values were used to calculate those in Table 5.
TABLE 5
‘Book’ values as a percentage of
respective soybean mean value (moisture equalized)
|
Component(s) |
Unit |
Soybean meal |
Cottonseed |
Peanut |
Sunflower seed |
Canola |
Coconut |
|
Dry matter |
% |
90 |
90 |
90 |
90 |
90 |
90 |
|
Crude fat |
% |
100 |
50 |
39 |
94 |
117 |
98 |
|
Non dietary fibre |
% |
100 |
319 |
178 |
302 |
238 |
564 |
|
Energy |
|
|
|
|
|
|
|
|
Swine ME |
kcal/kg |
100 |
68 |
94 |
78 |
78 |
74 |
|
Swine NE |
kcal/kg |
100 |
66 |
105 |
78 |
80 |
82 |
|
Poultry ME** |
kcal/kg |
100 |
98 |
88 |
92 |
82 |
61 |
|
Crude protein |
|
100 |
87 |
101 |
86 |
75 |
45 |
|
Arginine |
% |
100 |
131 |
143 |
81 |
64 |
67 |
|
Histidine |
% |
100 |
91 |
81 |
70 |
75 |
30 |
|
Isoleucine |
% |
100 |
60 |
81 |
65 |
66 |
34 |
|
Leucine |
% |
100 |
67 |
76 |
61 |
70 |
36 |
|
Lysine |
% |
100 |
57 |
54 |
38 |
69 |
19 |
|
Methionine |
% |
100 |
100 |
76 |
118 |
110 |
51 |
|
Methionine + Cystine |
% |
100 |
97 |
84 |
102 |
117 |
44 |
|
Phenylalanine |
% |
100 |
92 |
96 |
67 |
60 |
34 |
|
Phenylalanine + Tyrosine |
% |
100 |
81 |
96 |
62 |
61 |
33 |
|
Threonine |
% |
100 |
74 |
67 |
70 |
86 |
35 |
|
Tryptophan |
% |
100 |
74 |
72 |
66 |
69 |
29 |
|
Valine |
% |
100 |
78 |
85 |
74 |
80 |
46 |
** National Research Council, 1994
OTHER CONSIDERATIONS IN THE EVALUATION OF PROTEIN MEALS
Amino acid availability. The above values are on the basis of total levels present. In reality, not all of the protein that is present can be digested and thus beneficially utilized by an animal. Protein availability varies with native protein characteristics as well as processing induced changes. As our understanding, information resources and ability to monitor and control continue to improve, the industry is moving to the use of bio-available as opposed to total amino acids.
Toxic and antinutritional factors. As mentioned, certain whole oilseeds contain toxic and/or antinutritional factors. The presence of these compounds in the meal must be evaluated and considered.
TABLE 6
Amino acids expressed as a percentage of total
crude protein
|
Component(s) |
Unit |
Soybean meal |
Cottonseed |
Peanut |
Sunflower seed |
Canola |
Coconut |
|
Crude protein |
% of meal |
47.5 |
41.4 |
49.1 |
42.2 |
35.6 |
21.9 |
|
Arginine |
% of protein |
7.3 |
11.0 |
10.4 |
6.9 |
6.2 |
10.9 |
|
Histidine |
% of protein |
2.7 |
2.8 |
2.2 |
2.2 |
2.7 |
1.8 |
|
Isoleucine |
% of protein |
4.5 |
3.1 |
3.6 |
3.4 |
4.0 |
3.4 |
|
Leucine |
% of protein |
7.7 |
6.0 |
5.8 |
5.5 |
7.2 |
6.2 |
|
Lysine |
|
6.4 |
4.2 |
3.4 |
2.8 |
5.8 |
2.6 |
|
Methionine |
% of protein |
1.4 |
1.6 |
1.1 |
1.9 |
2.1 |
1.6 |
|
Methionine + Cystine |
% of protein |
3.0 |
3.3 |
2.5 |
3.5 |
4.6 |
2.9 |
|
Phenylalanine |
% of protein |
5.0 |
5.3 |
4.8 |
3.9 |
4.0 |
3.8 |
|
Phenylalanine + Tyrosine |
% of protein |
8.9 |
8.3 |
8.5 |
6.4 |
7.2 |
6.5 |
|
Threonine |
% of protein |
3.9 |
3.3 |
2.6 |
3.2 |
4.5 |
3.1 |
|
Tryptophan |
% of protein |
1.4 |
1.2 |
1.0 |
1.0 |
1.3 |
0.9 |
|
Valine |
% of protein |
4.8 |
4.3 |
4.0 |
4.1 |
5.1 |
4.9 |
Functional considerations. Physical characteristics can be an issue in certain applications, such as when the feed is to be pelleted. In this situation, nutritional considerations may be outweighed by inappropriate levels of fibre and fat, which limit its practical use in certain applications. Palatability of an ingredient or lack thereof, is also a factor.
Wholesomeness. Meals should be free of mycotoxins and other harmful materials. In addition, the residual oil in a meal should not be rancid.
Consistency. An important assumption in modern feed formulation is that the nutritionist can accurately describe the nutritional characteristics of the ingredients used. When an ingredient is subject to wide fluctuations in composition, it greatly complicates the process and ultimately adds cost.
Varying degrees of control can be exercised in relation to most of the above items. Presently, much of this control is in the realm of the processor. The extent to which the processor views the protein meal as a quality product, or conversely views it as ‘waste’, determines the amount they are willing to invest in quality control. End users have a role in this process by developing closer relationships with processors and encouraging them to work on quality related aspects of their meal products.
Another potential control point is the compositional characteristics of the oilseed. Variation in oilseed composition is a function of genetic background and the growing environment. The relative impact of each in the context of the oilseed meal traits of greatest interest has yet to be determined. We have limited control over environment but have much greater command over the genetic backgrounds of the plants we grow. Improving compositional characteristics through plant genetics has become a major focus for many research and business efforts.
MOVING FORWARD
Improving oilseed meal characteristics continues to attract considerable attention. There are two general approaches, one focuses on the processing step, the other involves altering the composition of the oilseed using plant-breeding technologies. However, tangible progress continues to be a challenge. Summarized below are some general considerations for success in such an endeavour.
General considerations for moving forward include:
1. Incentive. To invest in change, there must be an incentive. Within the business environment in which we function, incentive ultimately takes an economic form. One form is more profit per unit sold, either through higher prices and/or lower production costs. Another form relates to volume sold.
a. Equitable incentives must exist to ensure the participation of all required segments. When a series of business relationships exist, such as those associated with the production and use of oilseeds and their products, this greatly complicates the process. In addition, the whole process can be blocked by the refusal of one value chain link to participate.
b. For oilseed meals, added inherent value is translated into economic value by the animal production segment. This value will most likely be associated with a decreased ingredient cost per tonne of feed produced. A mechanism for distributing the value created at the end of the value chain to the other value chain participants must exist.
2. Required investment and by whom. To date, a major part of the investment in these areas has focused on the seed sector of the value chain. (This concentration of investment may have resulted in unreasonable expectations of return by this segment.) Yet, the benefit is translated into a tangible economic value by the animal producer at the opposite end of the value chain. Since the entire value chain has the potential for benefit, investment related risk should be spread throughout the value chain.
3. Potential for success. There must be a rational plan for identifying and achieving objectives. As a minimum, this should include.
a. Tangible targets with definable value.
b. For plant derived traits, a reasonable genetic basis for expression.
c. A system for capturing value added and its equitable distribution. (Such a system must be able to hold the trust of all participants.
d. The assembly or creation of needed tools and associated infrastructure.
Among oilseed meals and in the majority of practical feeding situations, soya is the leader in market share, market value and applied nutritional value. Changes to the soybean thus have a tremendous potential for impact on the oilseed market segment. Different research groups continue to look at improving various compositional characteristics of soybean for targeted market applications. Table 7 is an incomplete list of nutrition-oriented traits, which have been discussed and targeted for improvement.
Traits are included in such a list based upon the assumption that they will result in enough additional value to justify their development and commercialization. (the incentive.) Most business models associated with such traits require the use of Identity Preservation (IP) systems. Such systems add considerable cost to the soybean meal process. This added cost must be deducted from the value added through use of the characteristic.
THE UNITED SOYBEAN BOARD’S BETTER BEAN INITIATIVE
The United Soybean Board (USB), a United States soybean producer funded organization, has undertaken a project focused on the compositional improvement of commodity soybeans. This project is the Better Bean Initiative (BBI).
TABLE 7
Nutritional traits of soybeans targeted for
future improvement
|
Trait |
Primary application(s) |
|||
|
Animal feed |
Human foods |
Environmental |
||
|
Poultry |
Swine |
|||
|
Meal traits |
|
|||
|
Increased lysine |
X |
X |
|
|
|
Increased methionine |
X |
X |
|
|
|
Increased crude protein |
X |
X |
X |
|
|
Improved protein profile |
X |
X |
|
X |
|
Improved carbohydrate profile |
X |
X |
X |
X |
|
Higher isoflavone |
? |
? |
X |
|
|
Lox-null |
|
? |
X |
X |
|
Low phytate |
X |
X |
|
X |
|
High phytase |
X |
X |
|
|
|
Oil traits* |
|
|||
|
Reduced saturates |
|
|
X |
|
|
Reduced linolenic |
|
|
X |
|
|
High oleic |
|
|
X |
|
|
High stearate |
|
|
X |
|
|
Conjugated linoleic acid |
? |
? |
X |
|
* Meal characteristics must be assessed
While the BBI incorporates some aspects of past value adding initiatives, it also involves some unique characteristics of its own. The following brief presentation of the BBI is intended to serve as a framework for presenting some of the issues outlined above and as an alternative approach for addressing them.
The Better Bean Initiative
1. The incentive is to increase demand for US commodity soybeans. While the primary goal is to further expand usage, there is a unit price consideration associated with any increase in demand.
2. USB has been the initial investor in the BBI. However, as the project moves forward, it will require investments by other value chain participants. Such investments can take forms other than direct cash outlays. As this occurs, USB’s role will increasingly become that of facilitator.
3. The plan is to improve the inherent compositional value of soybeans relative to specified end uses. Both oil and meal characteristics are being addressed. BBI has funded projects focused on the following three areas:
a. Development of soybeans bearing targeted oil traits.
b. Development of soybeans bearing targeted meal traits.
c. Identification and development of tools which will better enable and thus support the infrastructure which will be required.
The meal traits targeted by the BBI for improvement are presented in Table 8.
TRANSLATING TRAIT CHARACTERISTICS INTO ESTIMATES OF ECONOMIC VALUE.
From a broad feed application perspective, the assigning of a ‘hard’ economic value to a given value-adding trait is not practical. Several factors are constantly at play relative to the actual value a trait may have. Included are:
Competitive ingredients available and respective costs as impacted by time and location.
1. The different nutritional needs of different animal species.
2. The different nutritional needs within a species based upon age/stage of production and environment.
3. The impact on feed formulation parameters utilized as influenced by differences in:
a. The perspectives of the nutritionists involved as a result of their unique set of past professional experiences.
b. The specific business objectives of a company.
However, the projection of such values is critical to the making of objective business decisions regarding altered compositional traits. Such estimates, however, must always be evaluated in the context of the scenario assumptions utilized in their development. The information presented below (Table 9) is based upon the least cost formulation of a broiler type feed. It focuses on the Primary BBI Traits identified above. Pertinent assumptions and costs are presented in the footnote to the table. The above values for the Reduced Phytate Bound Phosphorus trait do not include any environmental value. However, based upon the above model, each tonne of complete feed fed would be associated with 0.5 kg less phosphorus finding its way into the environment as a part of the manure. The cost of compliance with environmental regulations focused on phosphorus in manure will determine this economic component of the trait.
TABLE 8
BBI soybean meal trait end points
| |
Changes in high protein meal |
Maximum displacement of selected ingredient for each 100 kg of meal used |
|||
|
From |
To |
Coefficient of change |
|||
|
Primary traits |
|
|
|
|
|
|
Increased methionine + cystine |
1.4% |
2.1% |
1.5 X |
0.7 kg DL methionine |
|
|
Reduced phytate bound phosphorous |
0.4% |
0.2% |
0.5 X |
0.95 kg monocal phos. |
|
|
Increased metabolizable energy (ME) (from improved carbohydrate characteristics) |
^ 330 kcal ME/kg |
Swine: approx. 1.1 X |
4.2 kg added fat |
||
|
Secondary traits |
|
|
|
|
|
|
Improved utilization of protein/amino acids |
^ by a min. of 5% |
1.05 X |
5 kg soybean meal |
||
|
Increased levels of: |
|
|
|
|
|
| |
Lysine |
3.0% |
3.7% |
1.23 X |
0.88 kg L-lysine HCI |
|
Threonine |
1.9% |
2.3% |
1.21 X |
0.4 kg L-threonine |
|
|
Tryptophan |
0.65% |
0.80% |
1.23 X |
0.15 kg L-tryptophan |
|
Note: Must ensure that improvements in one area do not result in overriding losses in others
TABLE 9
Gross benefit estimates for a broiler based
scenario. Feed ingredient cost savings and associated gross added
values
|
Primary traits |
Feed ingredient cost (US$) |
Meal in feed (kg/t of feed) |
GAV* based on gross savings and meal usage |
||
|
Cost/t |
Gross savings |
$/t meal |
$/m3 soybeans |
||
|
‘Typical’ soybean meal |
123.83 |
|
278 |
|
|
|
Increased methionine + cystine |
120.81 |
3.02 |
277 |
10.93 |
6.24 |
|
Reduced phytate bound |
123.03 |
0.80 |
277 |
2.91 |
1.70 |
|
phosphorous** |
120.51 |
3.32 |
274 |
12.17 |
6.81 |
|
Increased metabolizable energy |
116.79 |
7.04 |
273 |
25.87 |
14.75 |
|
(ME) |
|
|
|
|
|
|
Primary traits combined |
|
|
|
|
|
* Gross savings and gross added value (GAV) does not include added costs associated with procurement and use of the respective meals
** Does not include ‘environmental value’
Footnote to Table 9. Elected inputs/assumptions. Broiler ‘composite’ formulation: corn-soya based diet.
Corn @ $57/m3: all soybean meals @ $176/t: L-lysine HCI @ $1.87/kg: DL methionine @ $2.2/kg: Animal fat @ $0.22/kg: monocalcium phosphate @ $276/t
While a significant amount of value can be shown per tonne of feed, the value per cubic metre of soybeans is not a great enough incentive to adopt a system with high intellectual property (IP) costs. A key to success is the ability to bring such a bean through the value chain at minimal added cost. Thus, BBI’s commodity approach.
MOVING BEYOND THE VISION
Creating a better bean. Obviously, a critical component for the success of BBI is the creation of soybeans that provide for the traits discussed earlier. Recognizing that progress can most rapidly be made by building upon that which already exists, a large part of BBI’s current meal related activities is focused on identifying sources of existing germplasm to meet the BBI meal trait targets, and then gaining access to its use.
One tactic involves developing relationships with companies that have been working on improving the compositional characteristics of soybeans; another focuses on public soybean plant breeders. In both instances, the BBI commodity approach is a tactic to commercializing materials that does not represent enough value in the context of an IP system.
The biology involved is always a factor. The extent to which genetic and associated compositional diversity exists determines the boundaries in which we must work. However, the opportunity may be much broader than once thought. Gizlice et al. (1994) have determined that only six ancestors account for more than half of the genetic base for North American soybeans. Eighty four percent of the total genetic base is drawn from only 17 ancestors. The possibility for expanding beyond this narrow genetic base should be evaluated in the light of over 15 000 samples within the USDA Soybean Germplasm Collection. USB’s Meal Trait Identification Project has begun to access this Collection as well as other potential opportunities.
Commercializing a better bean. Once a better bean is created, it must still survive the commercialization gauntlet. For the commodity concept to be viable, Germplasm providing for BBI traits must be accessible throughout the seed industry. At the same time, intellectual property rights of the owners of Germplasm must be respected and rewarded. All of this must be done without adding excessive cost to the system. While the focus is on creating a better commodity-type soybean, the early stages of commercialization will probably require some initial degree of IP.
Appropriate animal feeding evaluations will also be an important component of the commercialization process.
OILSEED PROTEINS: NOW AND IN THE FUTURE
Oilseed proteins are a critical contributor to the commercial viability of the animal production industries, as they exist today. Conversely, the animal production industries’ use of oil seed proteins returns considerable value to the oilseed production and processing industries.
To the extent that these two segments are mutually dependent, beneficial changes are shared. Considerable incentive exists for the compositional improvement of oilseed meals. Irrespective of who starts the process, all value chain components must participate and be able to derive benefit.
A result of such activities will be an ongoing change in the nutritional characteristics of the oilseed meals made available to the market. This will result in new competitive pressures, which ultimately encourage greater efficiencies in the sectors involved. Historically animal feed nutritionists quickly learned how to maximize their use of new ‘co-products’ and other ingredients as they became available to the marketplace. The ability to have the flexibility to react to such opportunities is a competitive advantage.
Animal feed formulation is a competitive process. Since many ingredients can be substituted for one another, they continually compete for use in the context of animal feeds. Such competition ensures the optimal utilization of feed ingredient resources while also allowing for lower animal production costs. Ultimately, large segments of the human population benefit from the resultant increased availability of lower cost, quality food. Future improvements in oilseed proteins promise to play an important role in this continuing process.
REFERENCES
USDA. 2002. Counsellor and Attaché Reports Official Statistics, USDA Estimates, FAS, April 2002.
Gizlice, Z., Carter, T.E. & Burton, J.W. 1994. Genetic Base for North American Public Soybean Cultivars Released between 1947 and 1988, Crop Science, 34: 1143-1151.
National Research Council. 1994. Nutrient Requirements of Poultry. Washington, DC, National Academy Press.
National Research Council. 1998. Nutrient Requirements of Swine. 10th Edition. Washington, DC, National Academy Press.
![]()
![]()
![]()