![]()
![]()
![]()
* Steve Tilley is currently employed as Deputy Director of the Coastal Resources Management Program of the Commonwealth of the Northern Marianas Islands. E-mail: [email protected]. Previously, Steve worked for 27 years in land use and coastal management programs for local and state agencies in Washington State. He also served as Senior Advisor to Proyek Pesisir (Coast Project), Indonesia from 1999 to 2003. Many thanks to Rose Curran, Ph.D. of King County ([email protected], Tel +1-206-205-0715) and Astrid Scholz, Ph.D. of Ecotrust (PO Box 29189, San Francisco, CA 94129, USA, Tel +1-415-561-2433, [email protected]) for their great assistance in preparing this paper. Graphics were prepared by Toni Weyman Droscher.
This paper was written to accompany the FAO Fisheries Technical Paper No. 439. FAO Technical Paper No. 439 provides guidelines for the collection of demographic and socioeconomic information on fishing communities for use in coastal and aquatic resources management. While conditions in Puget Sound are very different from the target areas for the Technical Paper, the Puget Sound experience may provide useful insights into how data can be used in developing performance indicators.
The Puget Sound basin covers more than 16 000 square miles and is located in the northwestern United States of America. Around 4 million people live in the basin. A complex network of federal, state and local laws govern the use of Puget Sound’s coastal resources. Significant aspects of the Puget Sound ecosystem have been heavily impacted by urban and rural development and by harvesting of upland and aquatic resources. However, the Sound still has many high quality fresh and marine water bodies and hosts a diverse community of aquatic life.
FIGURE 1
Location of Washington State, Puget
Sound, and King County
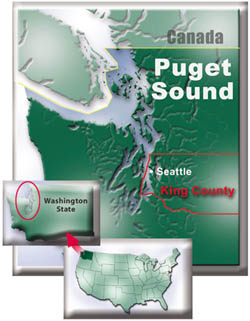
Source: Puget Sound Water Quality Action Team.
In 1990, the Washington Legislature adopted the Growth Management Act (GMA).[35] The Legislature feared that uncoordinated and unplanned growth would threaten the economy, environment and health and safety of the state’s residents. Rapid growth in the 1980s had produced urban sprawl, congested streets, flooding, loss of farmland, polluted shellfish beds and loss of critical habitats.
The GMA provides a policy framework and tools for land-use planning conducted by local governments (counties and cities). In Washington, counties are general-purpose local governments that may include one or more cities. In relation to land-use planning, cities and towns have authority to plan within their boundaries and counties are responsible for planning for areas outside city boundaries.
The basic objectives of the GMA are to “manage and direct growth to urban areas where public facilities and services can be provided most efficiently, to protect rural character, to protect critical areas, and to conserve natural resource lands.”[36] Specific GMA goals address urban growth, sprawl, transportation, housing, economic development, property rights, permits, natural resource industries, open space and recreation, environment, citizen participating and coordination, public facilities and services, and historic preservation.[37]
Within this state policy framework, local governments develop policies, plans and regulations to manage land development and to guide infrastructure investments. At the beginning of the programme, each county worked with the cities in the county to adopt countywide policies. The policies below provide guidance and coordinate development objectives among the counties and their cities and towns:
Once they began planning, the counties, cities and towns conducted studies on land use, economy, housing, environment, and other issues. They designated urban growth areas outside of which urban development will not occur. They developed comprehensive land-use plans that include specific chapters to address land use, housing, capital facilities, utilities, transportation, rural lands (for counties) and shorelines.[39] Comprehensive plans must be consistent with the GMA, with countywide planning policies, and with the plans of adjacent jurisdictions. Development regulations and individual developments must be consistent with the comprehensive plan. The overall growth management system is shown in Figure 2.
FIGURE 2
Growth management
framework
The state and local governments collect demographic and socioeconomic data to track implementation of the GMA. Two examples are described here - population growth and local benchmarks.
A key requirement of the GMA is that counties, cities and towns allocate adequate land area to accommodate the projected 20-year population growth.[40] Initially, the state projected population growth and allocated a portion to each county. The state projection was expressed as a high and low range within which local governments could target their growth (see Figure 3). Counties worked with cities and towns to allocate the population growth among them. Now, the state tracks actual population growth and updates the population forecasts every five years. Local governments adjust their population allocations and development plans, as necessary. The population that needs to be accommodated by a given area depends on:
Growth management benchmarks are another approach to the use of demographic and socioeconomic information. The GMA requires counties, in consultation with cities, to adopt countywide policies as a framework for adoption of county and city comprehensive plans. These policies are to include policies on review and evaluation to determine whether urban densities are being achieved and to identify reasonable measures, other than adjusting urban growth areas, which will be taken to comply with the requirements of the GMA. Under this authority, “counties and cities may establish indicators, benchmarks, and other similar criteria to use in conducting the evaluation.”[42]
King County (Figure 1), on the eastern shore of Puget Sound, provides an example of how benchmarks can be used to track implementation of countywide policies. With a total population of 1.8 million, the county is the thirteenth largest in the United States of America. Seattle is the biggest city in the county with a population of nearly 600 000 while the unincorporated area of the county has 350 000. The remaining population is divided among 38 other cities and towns. Cities and towns are subject to state laws but are largely independent of the county. Seattle is a major seaport: Port-related operations accounted for more than 83 000 jobs in 1999.
FIGURE 3
Example of population growth projections
given to counties
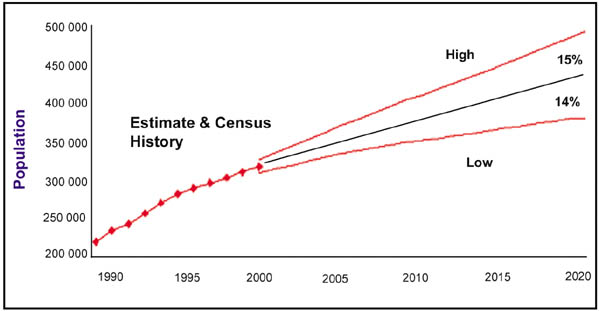
Source: Lowe, October 2001
King County, together with its cities, developed and adopted countywide policies in 1994 and the benchmark system in 1995. The purpose of the benchmark system is to determine whether the countywide policies are achieving their intended outcomes, and whether the quality of life as measured by the indicators is improving, declining or holding steady. Table 1 shows the King County’s 2002 benchmark outcomes and indicators. The County tracked each indicator and has produced benchmark reports annually from 1996 through 2002. For each indicator, the report provides a definition, analyses the data, and explains what is being done about the issue (see Figure 4). An appendix identifies the source of the data and explains the rationale for each policy.[43] A decision was made not to include targets for most indicators.
The King County Benchmark Programme looks at quality of life indicators rather than specific programme-level performance measures. The objective is to use high-level indicators to encourage better practice and improve results. The benchmark system, including the indicators, is intended to “provide early warning if the policies are not having their desired effects. In that case, the system should provide sufficient information to enable policy-makers to determine whether different actions to implement the policies are needed, or whether minor or major revisions to the policies are required. More specifically, the Benchmark System should be used to help the jurisdictions of King County establish priorities, take joint actions, and direct resources to solve problems identified in the Countywide Planning Policies.”[44] To diagnose which actions need to be taken to solve specific problems, the county and cities rely on more specific performance monitoring at the department, agency and programme levels. The primary responsibility for programme and policy change rests with agency heads, programme directors and policy makers.
The process of developing the benchmarks was valuable in itself. The county worked hard to involve the public in building consensus and focusing on necessary strategies to achieve the desired outcomes. Technical task forces and stakeholders participated in developing the benchmarks. They started by considering more than 100 indicators and narrowed them to 45. Local elected officials believe that just the fact of monitoring process demonstrates that plans are being used and goals are kept alive. This allows them to make needed adjustments to programmes.[45]
Over time, the indicators are adapted to suit changing conditions. For example, in 2002, the county noted, “...some of the indicators have been omitted. In several cases, there is not yet any reliable trend data available for that indicator. Sometimes this reflects a lack of funding to collect the necessary information; in other cases, current data is being developed, but there is no data for comparison to the past. There are several other indicators which have been left out this year because there is no significant change in the data from one year to the next...in one or two cases, the indicators themselves may need to be reevaluated.”[46]
The linkage between benchmark indicators and policy changes is becoming more formalized. The indicators report now goes to policy makers, the King County Council, planning directors, mayors, department heads, and others. Different people use data for different purposes. In some cases, policy makers use the information as the basis for policy change.
Benchmark reports have stimulated policy changes. The reports showed that land use policies were permitting too many units in rural areas compared to long-term targets. Local governments then tightened zoning and regulations and the rate of development in rural areas declined. In another case, benchmark reports showed a lack of affordable housing and inequitable distribution around the county. The county conducted a survey and identified strategies that would increase the stock of affordable housing and publicized the information. In a third case, the benchmark reports highlighted a decline in high school graduation rates from the late 1980s to the late 1990s. Policy makers eventually became quite concerned; the benchmark reports raised consciousness in the county even though the county government didn’t have a direct control over the education system.[47]
King County identified the following main challenges of their monitoring programme:
TABLE 1
2002 King County benchmark outcomes and
indicators
|
Outcomes |
Indicators |
|
|
|
|
Promote family-wage jobs |
1. Real wages per worker |
|
Increase income and reduce poverty |
2. Personal and median household income: King County compared
to the United States of America |
|
Increase business formation, expansion and retention Create jobs that add to King County's economic base |
4. New businesses created |
|
Increase educational skill level |
7. Educational background of adult population |
|
|
|
|
Protect and enhance natural ecosystems |
9. Land cover changes in urban and rural areas over time |
|
Improve air quality |
10. Air quality |
|
Protect water quality and quantity |
14. Water consumption |
|
Protect wetlands |
16. Change in wetland acreage and functions |
|
Protect the diversity of plants and wildlife |
17. Continuity of terrestrial and aquatic habitat networks |
|
Increase salmon stock |
18. Change in number of salmon |
|
Decrease noise levels |
19. Rate of increase in noise from vehicles, planes and yard equipment |
|
Decrease waste disposal and increase recycling |
20. Pounds of waste disposed and recycled per capita |
|
|
|
|
Provide sufficient affordable housing for all King County residents |
21. Supply and demand for affordable housing |
|
|
|
|
Promote affordable home ownership opportunities |
25. Home purchase affordability gap for buyers with (a) median
renter household income and (b) median household income |
|
Promote equitable distribution of affordable low income hosing throughout King County |
28. Public dollars spent for low income housing |
|
|
|
|
Encourage a greater share of growth in urban areas and urban centres, limit growth in rural/resource areas |
30. New housing units in urban areas and rural/resource areas,
and in urban centres |
|
Make efficient use of urban land |
32. New housing units built through redevelopment |
|
Accommodate residential and job growth in urban areas |
35. Ratio of land capacity to 20-year household and job
targets |
|
Encourage liveable, diverse communities |
37. Acres of urban parks and open space |
|
Balance job and household growth |
38. Ratio of jobs to housing in Central Puget Sound counties, and King County subregions |
|
Maintain quality and quantity of natural resource lands |
39. Acres in forest land and farm land |
|
|
|
|
Transportation and land use linkage |
41. Percent of residents who commute one-way within 30 minutes |
|
Availability of modes other than single occupant vehicle |
42. Metro transit ridership |
|
Mode split |
43. Percent of residents who walk or use transit, bicycles or carpools as alternatives to the single occupant vehicle |
|
Reduce commercial traffic congestion |
44. Ability of goods and services to move efficiently and cost effectively through the region |
|
Protect and improve transportation infrastructure |
45. Number of lane miles of city, county, and state roads and bridges in need of repair and preservation |
Source: Growth Management Planning Council and Office of Management and Budget, 2002
FIGURE 4
Example of King County benchmarks
discussion
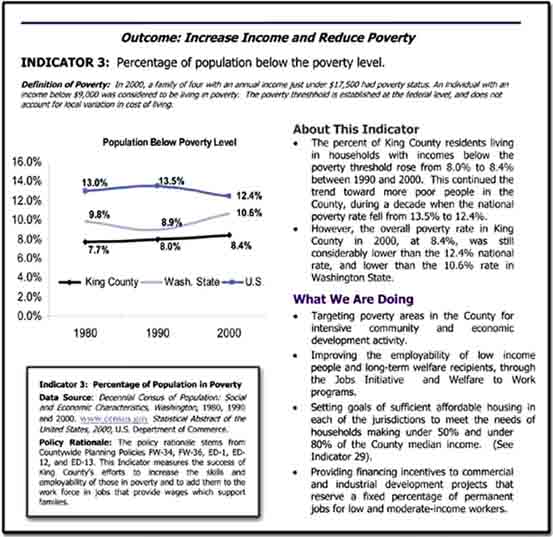
Source: Growth Management Planning Council and Office of Budget, King County, Washington
There are several other Puget Sound examples of using indicators to track the sustainability of development. However, neither of the following cases has a direct programme link between the indicators and programme decision-making.
The City of Olympia, Washington produced State of the Community reports in 1996, 1998 and 2003.[49] Now, the City is moving to a benchmarks/performance measures project for each department. The 2003 report will be put on the Internet to educate citizens and help them become more aware and involved.[50]
Pierce County, Washington developed a benchmark system and produced reports to assess the community’s quality of life.[51] The project collected and analysed annual data from 1989 onwards and produced indicator reports in 1994, 1995 and 1996. 1990 served as the benchmark year from which changes were measured. Topics covered were housing, air, water, waste, culture, recreation, education, transportation, jobs, businesses, crime, health and land use. The data is still available on the Internet but the project has been disbanded because it was not being used. This is a good caution in collecting data and producing indicators: If not official sanction, they must have visibility, political support and utility.
The Sustainable Community Roundtable illustrates a non-governmental approach in the evolution of indicators.[52] Initiated by the City of Olympia in 1991, the Roundtable was incorporated as a non-profit organization in 1992.
The Roundtable conducted extensive consultations with the community about indicators of sustainability in the areas of housing, economy, energy, etc. State of the Community reports were reproduced annually from 1993 to 1999. Sustainable Seattle is another nongovernmental indicators project with a long history.[53]
Tracking of shellfish harvest area in Puget Sound provides an example of environmental measures that are directly linked to socio-economic conditions. Washington State is the leading producer of farmed shellfish in the United States of America. The Pacific Shellfish Growers Association estimates the wholesale value of commercial oyster, clam, and mussel production in Puget Sound at about US$50 million per year. In addition to the economic value, shellfish in Puget Sound are also important to the region’s heritage and quality of life. In 1998, nearly a quarter of a million people harvested shellfish from Puget Sound’s beaches, taking around 700 000 pounds of clams and 900 000 pounds of oysters.[54]
However, the continued viability of the commercial and recreational harvest depends on the water quality of Puget Sound. Contaminants from urban and rural sources can render shellfish unfit for human consumption. Since 1980, around a quarter of the area classified for commercial shellfish harvesting has been downgraded and taken out of production. The primary problems were: inadequately treated sewage from municipal and on-site systems; contaminated stormwater runoff; and waste from marinas, boaters, farm animals, and wildlife.[55]
Many entities are involved in protecting and restoring shellfish as an economic and recreational resource. These include state agencies, tribal and local governments, universities, shellfish growers, citizen committees and non-profit organizations. Intervention programmes include enforcing water pollution laws, overseeing shellfish harvesting, providing financial and technical assistance to tribal and local governments, research and public education.
Monitoring and classifying shellfish beds are critical components of this effort. The Washington Department of Health publishes annual growing area reports and the Annual inventory of commercial and recreational shellfish areas of Puget Sound. This provides information on water quality conditions and highlights areas threatened by contamination and classification downgrades. These reports provide an early warning that state agencies use to alert and work with local governments in protecting and restoring shellfish beds.[56]
FIGURE 5
Programs for protecting and restoring
shellfish in Puget Sound
Figure 5 outlines the programme for maintaining the health of shellfish beds. Annual monitoring identifies areas needing special attention; other programmes address pollution sources in all locations. The indicator used here - area of shellfish beds approved for harvest, is not a direct socio-economic measure. However, it does measure the resource available to the industry. The shellfish industry works closely with the government agencies at all stages of this cycle to maintain approved harvest areas and to restore areas where harvest has been restricted.
The Department of Health (Health) classifies all commercial shellfish growing areas in Washington State as Approved, Conditionally approved, Restricted or Prohibited for harvest. These classifications have specific standards associated with them, which are derived from federal guidelines.[57] From this information, Health produces a map and list of threatened shellfish growing areas (see Figure 6). This information also feeds into the technical report Puget Sound update and the popular Health of Puget Sound [58] report produced by the Puget Sound Water Quality Action Team (Figure 7).[59]
FIGURE 6
Threatened shellfish growing
areas
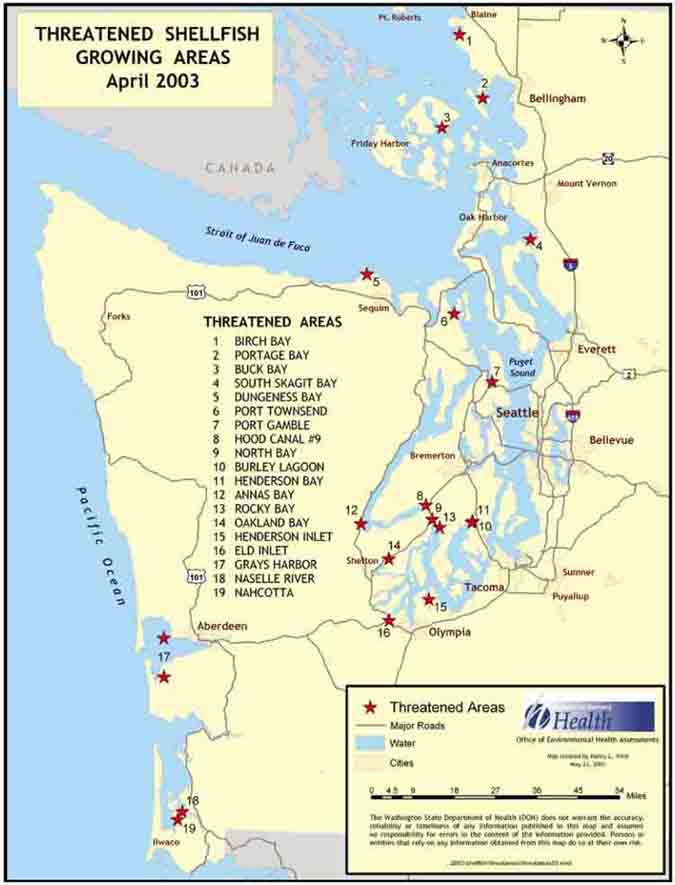
Source: Washington Department of Health, 2002 (p. 12)
FIGURE 7
Historical trend of shellfish
indicator
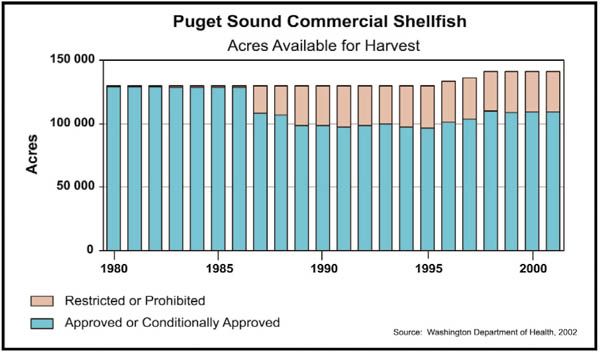
Source: Puget Sound Water Quality Action Team, 2002
The Puget Sound water quality management plan establishes a system for state agencies and local and tribal governments to use the indicators to prevent contamination of shellfish areas. “When shellfish areas are identified as threatened in the annual growing area reports, the agencies and governments shall collaborate and target their actions to restore water quality and prevent classification downgrades. When shellfish areas are officially downgraded by [the Department of] Health, the state agencies, local and tribal governments, and other affected interests shall develop and implement closure response strategies to restore water quality and to upgrade the classifications.”[60]
A 1992 state law also requires counties to establish shellfish protection districts to prevent contamination of shellfish areas when shellfish beds are downgraded due to non-point source pollution.[61] Counties may also establish shellfish protection districts on their own. Once districts are established, counties may levy fees on residents of the districts to pay for activities to monitor, restore and protect shellfish beds. Examples of actions that counties take to restore and protect shellfish beds include inspecting on-site sewage systems, requiring and assisting in repair of on-site systems, educating about and requiring control of farm animal and pet waste, land-use planning to control the pattern and standards of upland development, and educating businesses and homeowners about use of pesticides and fertilizers.
The Pacific Fishery Management Council (PFMC), a division of the United States Department of Commerce, manages the harvest of groundfish and other species on the west coast of the Unites States of America, including Puget Sound. A regional advisory council composed of stakeholders advises the PFMC. The fishery has four components: limited entry, open access, recreational, and tribal. Groundfish are managed through a number of measures including harvest guidelines, quotas, trip and landing limits, area restrictions, seasonal closures and gear restrictions (such as minimum mesh size for nets and small trawl footrope requirements for landing shelf rockfish).
After a period of initial expansion starting in 1976, fisheries on the Unites States West Coast, including groundfish landings, have been in severe decline since the early 1990s. In 2000, the PFMC adopted a strategic plan, Transition to Sustainability, which prioritises management options for ensuring the future of the fishery.[62] The top priority was to reduce fishing capacity by at least 50 percent in each fishery sector. This would ensure that West Coast groundfish resources are fished in a sustainable manner while improving the economic stability of the groundfish fleet. By 2002, large areas of the upper continental shelf were closed to fishing, and a vessel buyback for the limited entry trawl fleet had been initiated.
FIGURE 8
West Coast groundfish system and key
relationships
Source: Pacific Marine Conservation Council/Ecotrust, 2003 (p. 39)
Concerned about the socio-economic impacts on coastal communities, on the marine environment and on living resources, two regional non-profit organizations, the Pacific Marine Conservation Council and Ecotrust, partnered to conduct the Groundfish Fleet Restructuring Information and Analysis Project (GFR). GFR analysed options for reducing fleet capacity and changing the structure. These options were based on alternative scenarios and simulations that modelled the socioeconomic effects on the fishing operators and affected coastal communities.[63] These impacts could vary considerably from community to community, depending on local fleet composition, traditional target species, transportation, processing facilities and other portside infrastructure, and other factors. Any change in the composition of the fishing fleet and in the size, location and timing of fishing activity and effort along the coast would also affect the marine environment and living resources. The GFR was designed to assess these relationships and impacts, and to help inform the policy process. Figure 8 illustrates the relationships among the ecosystem, the fisheries and the coastal communities.
“The goals of the project were to:
compile a comprehensive set of data and information in a format that can be used by all who wish to explore fleet reduction options and other management measures;
produce a set of analytical, publicly available, tools including:
(a) fleet reduction scenarios that consider fleet composition, shore-based infrastructure, harvest history, spatial dynamics and economic trends from the perspective of local communities;
(b) a matrix or simulation to analyse potential social and economic effects of these scenarios; and
(c) case studies illustrating different port profiles, empirical information on fishing and processing businesses, market dynamics, and the potential effects of fleet buyout proposals and other management measures;
prepare a set of policy options as well as an executive report to be presented to the Pacific Fishery Management Council and made available to all interested parties.”[64]
The project gathered and analysed historical and current information on the fishery (fleet composition, landings, stock assessments, habitat and gear interactions, etc.), port and community infrastructure (processing and freezer capacity, labour demographics, distribution and marketing networks, etc.) and ecological resources (essential habitat, spatial distribution of fish and fishing efforts over time, etc.). This information was entered into a spatially explicit analytical framework useful to communities and decision-makers. A CD-ROM with all data sets and metadata is available through the project website (http://www.ecotrust.org/gfr/index.html). Figure 9 illustrates the data layers collected.
With this information the project developed and analysed four fleet reduction scenarios:
(a) reduce the total number of vessels in excess of those needed to harvest the 2000 allowable catch;
(b) reduce fleet capacity by 50 percent in each sector at random;
(c) reduce fleet capacity by 50 percent in each sector while preserving fleet diversity; and
(d) select vessels to remain in the fleet that meet minimum ex-vessel revenue levels in each sector, respectively.
FIGURE 9
Data layers collected
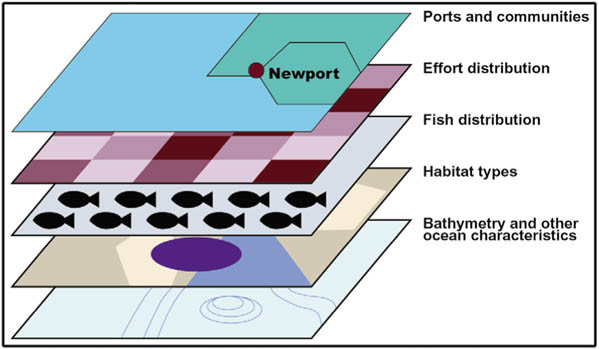
Source: Pacific Marine Conservation Council/Ecotrust, 2003 (p. 40)
For each scenario, various proportions of vessels in excess of those “needed” according to capacity utilization estimates were eliminated. Landings, ex-vessel revenues, incomes and fleet composition were then compared to the 2000 base year. This provided a static picture of different fleet scenarios and what might happen in communities, but was not a predictive analysis showing the ripple effects of changes in the fleet. Figure 10 shows the results for the Northern Puget Sound ports. The alternatives also did not take into account the political and practical considerations of reducing the fleet. What they did was to provide a neutral point of reference for discussions about fleet reduction. The analysis showed that fleet capacity reduction would have varying effects among coastal communities, on fleet diversity and on distribution of income within the remaining fleet.
FIGURE 10
Income generated in Puget Sound Ports
immediately after implementation of each scenario
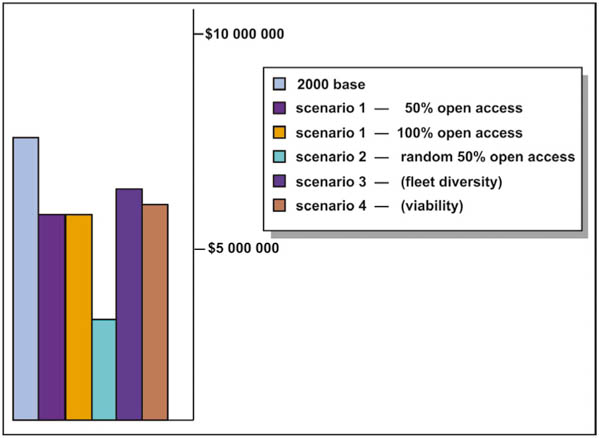
Source: Adapted from Pacific Marine Conservation Council/Ecotrust, 2003 (p.23)
GFR estimated changes in the incomes of harvesters and processors using economic input-output models. Income impacts were estimated for harvesters and processors at each port and the models predicted the multiplier effect on each community. The community effects were then rolled-up into coastwide impact estimates. The project estimated the immediate effects but not the long-term adjustments that would be made by the fishers and communities to adjust to the fleet reduction.
The GFR recognized that the culture of fishing is also important to the social cohesion of coastal communities. “...A central aspect of the GFR project was the collection and integration of other socioeconomic data into the analysis.
The ultimate goal is to develop a measure of community health and resilience in the face of changes in the fishery, potentially in a joint ecological-socioeconomic model we are exploring with academic partners. For the purposes of this project, however, we focused on identifying and integrating a variety of community-relevant data into the GFR framework. We approach this both through harvesting the fishery-dependent data in ways that we think are relevant for understanding how communities will make the transition and through a range of other data from sources like the United States Census Bureau.”[65]
In relation to fishery-dependent data, GFR used length as an indicator of vessel size and length along with gear types as a measure of fleet diversity. Preservation of fleet diversity was important to many people and organizations on the coast. The GFR added census and regional economic statistics from federal agencies on the community demographics such as educational attainment, county income and home ownership. This information could not yet be linked to directly to changes in the fishery. However, “...comparing data on, e.g. poverty, across different ports provides important context for considering fishery management measures. For example, reducing the fleet in a port with a higher rate of poverty or unemployment may have disproportionately larger effects than reducing the fleet in a well-diversified community.”[66]
The ultimate goal of the project, as it moves into its next phase, is to develop measures of community health and adaptability to change, such as an index of community resilience. Measures of location, demographics and economy such as commercial and marine infrastructure, distance from major cities or from other ports, or number and diversity of local businesses could be incorporated into one or more indices of community resilience to change. While there are currently no plans at the level of federal fishery managers (the PFMC) to monitor the impacts of management decisions on individual communities, the GFR serves as a baseline for various stakeholders, organizations and communities interested in conducting their own analysis and monitoring activities.
The three examples covered in this paper illustrate that indicators can be designed and used in a variety of ways and that many challenges accompany the use of indicators. The King County benchmarks illustrate how indicators can raise the consciousness of elected officials and influence policy decisions in unplanned ways. This feedback to policy is critical for continued support of the programme and for use of information in adaptive management. While Pierce County’s project also covered many important issues, lack of policy relevance eventually doomed the programme.
The Puget Sound shellfish monitoring programme shows how environmental information can have direct relevance to the health of an industry. Shellfish growers strongly support the programme and work closely with monitoring agencies and local governments to maintain and restore shellfish beds. Indicators should have advocates who can see the uses and benefits of data and lobby for necessary action.
Finally, the West Coast Groundfish Fleet Restructuring Project shows how local socioeconomic indicators can be nested within a regional framework. The study also illustrates that indicators should address the culture of fishing as well as basic economic and social welfare.
City of Olympia. 2003. State of the city report 2003. A biennial report on the City of Olympia’s social, economic and environmental health. Washington, USA. (Available at http://www.ci.olympia.wa.us/publicworks/reports.asp)
Growth Management Planning Council & Office of Management and Budget. 2002. King County benchmarks, 2002 King County benchmark report. The 7th annual report on progress in implementing the King County countywide planning policies. King County, Washington. (Available at http://www.metrokc.gov/budget/benchmrk/bench02)
Lowe, T.J. 2001. GMA Information Part I: Growth management November 2001 workshop powerpoint presentation. Information about the Office of Financial Management’s (OFM) growth management act (GMA) population projections. State of Washington Office of Financial Management/Forecasting. (Available at http://www.ofm.wa.gov/pop/index.htm#growth)
Pacific Fishery Management Council. 2000. Groundfish fishery strategic plan transition to sustainability. (Available at http://www.pcouncil.org/groundfish/gfother.html)
Pacific Marine Conservation Council/Ecotrust. 2003. Groundfish fleet restructuring information and analysis project, final report and technical documentation. (Available at http://www.ecotrust.org/gfr/index.html)
Pierce County. 1998. Pierce County quality of life benchmarks annual report (3rd Edition). Washington. (Available at http://www.co.pierce.wa.us/pc/services/family/benchmrk/qol.htm)
Planning Association of Washington. 1999. A short course on local planning, version 4.1. Washington State Office of Community Development.
Puget Sound Water Quality Action Team. 2000. 2000 Puget Sound water quality management plan. (Available at http://www.psat.wa.gov)
Puget Sound Water Quality Action Team. 2002. Puget Sound’s health 2002. (Available at http://www.psat.wa.gov/Publications/Pub_Master.htm)
State of Washington. 1990. Revised code of Washington chapter 36.70A.020. (Available at http://www.leg.wa.gov/rcw/index.cfm)
State of Washington. 1997a. Revised code of Washington chapter 43.62.35. (Available at http://www.leg.wa.gov/rcw/index.cfm)
State of Washington.1997b. Revised code of Washington chapter 36.70A.215. (Available at http://www.leg.wa.gov/rcw/index.cfm)
State of Washington. 1992. Revised code of Washington chapter 90.72.045. (Available at http://www.leg.wa.gov/rcw/index.cfm)
Sustainable Community Roundtable. (Website http://www.olywa.net/roundtable/index.html)
Sustainable Seattle. 1998. 1998 Indicators of sustainable community report. (Available at http://www.sustainableseattle.org/Programs)
U.S. Food and Drug Administration, Center for Food Safety and Applied Nutrition, Office of Seafood. 1999. Guide for the control of molluscan shellfish, model ordinance. Chapter IV. National Shellfish Sanitation Program (NSSP). (Available at http://vm.cfsan.fda.gov/~ear/nsspotoc.html)
Washington Department of Health, Office of Food Safety and Shellfish Programs. 2002. 2001 annual inventory: Commercial & recreational shellfish areas of Washington State. (Available at http://www.doh.wa.gov/ehp/sf/sfpubs.htm#GrowingAreasPubs)
Washington State Office of Community Development. 2000. Achieving growth management goals: Local success stories. (Available at www.ocd.wa.gov/info/lgd/growth)
The region of Liguria is situated on the Tyrrhenian coast in Northern Italy. It has a north-south extension of 316 km, covers an area of 5 416 square km and a resident population of about 1 625 000 inhabitants in 1999.
The population is distributed over 235 municipalities, 43 of which are located on the coast. Roughly 80 percent of the entire population of Liguria live in these coastal municipalities. The coastal municipality of Genova is the most populous, accounting for about 48 percent of the total population of the region.
The main economic activities of Liguria region comprise industry, agriculture, shipping and tourism.
Industry includes the energy sector (oil, electricity) and the iron and steel, chemical, mechanics, electronics, manufacturing, construction, textiles and the forest and timber industries.
The agricultural activities carried out in the region include the growing of olives, flowers and vines. In addition to these activities, the Regional Rural Development Plan emphasizes agritourism, development of rural infrastructure, technical assistance and promotion and marketing of agricultural products.
The most important commercial ports are located in Savona, Genova and La Spezia. La Spezia also has a naval base.
Tourism has developed rapidly during the last few decades and is playing an increasingly important role in the Ligurian economy, particularly in the coastal area.
As elsewhere in the Mediterranean, the number of fishing vessels in Liguria increased considerably after the Second World War and fishing technologies and methods were modernized. However, its fishery infrastructure (i.e. fish markets, commercial networks, fish processing and preservation facilities) did not improve and develop much. Partly as a result of this situation, there has been only marginal improvement in the working conditions and living standards of fishers and fish workers.
The growth of the industrial and other sectors of the economy enabled these sectors to offer higher wages than coastal fishing. As a result, fishing as an occupation became less attractive and the sector began to stagnate. Environmental disasters such as that caused by the sinking of the oil tanker Haven, the collapse of fish sales in the 1980s as a result of the presence of high concentrations of mercury and the presence of a parasite in some commercial fish species, and declining catches caused by overfishing and pollution also contributed to the decline of the fishery industry in Liguria.
Other factors that impacted negatively on the fishing industry of Liguria include industrial development and tourism in coastal areas; the increase of residential areas and population pressure (which have contributed to the pollution of coastal waters); and the activities of “illegal” part-time fishers, who sell fish at lower prices than the professional fishers who are members of fishers cooperatives.
According to a 1994 census, the professional fishers in Liguria number about 3 000, representing approximately 3 percent of the total fisher population of Italy. In addition to those engaged in fishing, another 2 000 persons are estimated to be involved in fish marketing, boat building and repair and other related activities.
The fishers of Liguria are relatively old with an average age ranging from 43 years in Savona Province to as many as 54 years in Genova Province. The high average age is another indicator of the declining role of coastal fishing in Liguria. Fishers are mostly organized in cooperatives, which also undertake the marketing of their products both locally and nationally.
According to the Osservatorio Ligure Pesca-Ambiente, 753 fishing boats were registered in Liguria in 1997, out of which 80 percent were less than 12 metres long. The type of fishing practiced along the coast of Liguria is characterized by the use of small motorboats; the use of a variety of mainly passive fishing methods including lines, pots, gillnets, etc. according to the environment and the season; involvement of a crew of 2-3 persons; one day/night fishing trips depending on weather conditions; and the targeting of high quality and value fish species. Fishing is largely carried out in an area between 3 and 6 miles from the shore, with most of the catch sold fresh and directly to local communities and tourists.
In addition to capture fisheries, aquaculture is practiced along the coast. Aquaculture in Liguria consists mainly of mussel culture, which is concentrated in the province of La Spezia. Three cooperatives are involved in mussel culture - one in hatchery activities and production of seed, another in mussel farming and purification, the third in marketing of mussels. The annual production of mussels is about 3 000 tonnes. In La Spezia, there is also a farm for the intensive culture of sea bass and sea bream.
Cage culture with floating cages has started recently in the municipality of Monterosso in the Cinque Terre area. Aquaculture is also being developed in the Province of Savona.
There are several plans and instruments which play a role in coastal planning and management in the Liguria Region and which consider and impact on demographic and socio-economic characteristics of coastal and fisher populations.
The Liguria Regional Programme for Fishing and Aquaculture for the period 2000-2006 was elaborated by the Liguria Region after consultation with fishers organizations such as the Associazione Pescatori Liguri, the Lega Pesca, the Federcoopesca and the Osservatorio Ligure per la Pesca e Ambiente.
The programme is based on an assessment of the fishery and aquaculture sector in Liguria. The strengths of the sector are seen in the presence of local fishing communities with a long tradition and profound professional skills, in the strong cooperative organization of fishers, in the high quality and value of the targeted and captured fish species and in the strong market demand both for fresh fish and processed fish products. The main constraints and weaknesses of the sector are identified as the lack of adequately equipped fishing ports, the lack of sufficient cold storage infrastructure, deficient fish marketing arrangements and promotional activities, and old and inefficient fish and mussel culture facilities and installations.
The Regional Law of Liguria Number 23 for Fishing and Aquaculture of May 1996 and the Regional Law Number 30 of August 1997, which modifies and amends the previous law, provide a series of measures in support of fishing and aquaculture such as measures in support of sea safety, of navigational and communication equipment of fishing vessels, of improved fish cold storage and transport infrastructure and facilities, of fishery credit facilities as well as measures in support of conversion of fishing vessels for the purpose of ecotourism and sport fishing.
Priority interventions and measures foreseen by the Liguria Fishery and Aquaculture Programme for the period 2000-2006 are:
Protection and rehabilitation of aquatic resources through the establishment of protec ted marine zones;
Improvement of aquaculture practices;
Construction and improvement of fishing ports;
Processing and marketing of fish products;
Financial incentives and technical assistance for coastal small-scale fishing communities and cooperatives;
Improvement of safety and quality of fish products and promotion of fish consumption;
Promotion of fisheries research and implementation of pilot projects in support of sustainable fisheries and aquaculture in Liguria.
Another important instrument of regional planning is the PTR or Piano Territoriale Regionale (Liguria Territorial Plan), as foreseen by the Liguria Regional Law Number 36/1997. It was approved in September 2002 as a so-called “preliminary document” (DGR number 963) and serves as a point of reference for the provincial and municipal territorial plans. It contains the objectives and sector specific goals and projects which the region wants to promote.
The Quadro Descrittivo (Descriptive Part) of the PTR analyses and makes proposals regarding the following themes:
The instruments for the execution of the territorial plan at subregional and local level are:
(a) the Patto Territoriale (Territorial Agreement), which can be promoted by local public administrations and by people’s organizations for integrated interventions concerning industry, agro-industry, services, tourism and infrastructure;
(b) the Contratto d’Area (Local Area Agreement), which can be promoted by local administrations and workers and business organizations in order to propose new economic activities for the increase of job opportunities in industry, agro-industry, services and tourism.
Another important instrument of coastal resource management is the PTCP or Piano Territoriale di Coordinamento Paesistico (Territorial Plan for Environmental Coordination), which aims to protect the quality of landscape and environment, to protect accessibility to public spaces such as beaches and coastal areas and to protect nonrenewable resources such as water sources, beaches, minerals, plains, forests etc.
The Piano della Costal (Coastal Plan) identifies the main sectors/projects of regional interest such as the protection of coasts and beaches through the prevention of beach erosion, the improvement of ports serving tourists, the conversion of abandoned coastal railway tracks to cycling roads/ pedestrian paths and the improvement of public transport and the coastal road/transport system in an environmentally friendly manner.
Finally, there is the PTC or Piano Insediamenti Produttivi (Plan for Economic Development) for the central part of Liguria. This plan (DCR number 95/1992 and DPGR number 44/2000) refers particularly to the industrial area of Genova Province and the eastern part of Savona Province, encompassing a total area of 2 600 square km. This area represents 48 percent of the total Liguria region and accounts for 74 percent of the population of Liguria. About 60 percent of the total population and 75 percent of the labour force of the entire region are concentrated in the urban area alone of Genova Province, which has an average population density of 14 000 inhabitants per square km.
The major industrial activities of the area include shipping, metal work and the production of chemicals, charcoal and oil.
The objectives of the PTC are to increase the competitiveness of industry and to stimulate innovation, to improve the urban environment and infrastructure and to improve the transport and communications system.
The main demographic and socio-economic indicators used for the formulation of the Piano Regionale Territoriale (Regional Territorial Plan) of Liguria Region are specified in the chapter on geography and include:
Population density in terms of number of inhabitants per square km, 1991;
Rate of natural population increase/decrease (= crude birth rate-crude death rate) expressed as a percentage of the population, 1990-1999;
Rate of migratory population increase/decrease (= in-migration into a municipality minus out-migration empirically measured as the difference between registrations and cancellations at the registry office of a municipality) expressed as a percentage of the population, 1990-1999;
Demographic balance (combination of natural and migratory population increase/decrease), 1971-1991;
Variation in the number of residents for the period 1991-1999;
Municipalities by number/class of residents (over 800 0000, 500 000-800 000,..., 1 000-5 000, 0-1 000),1861-1936;
Municipalities by class of residents, 1971-1991;
Hotels and restaurants, in terms of number of units and number of workers (increase/decrease), 1990-1996;
Manufacturing and commercial enterprises, in terms of number of units and workers (increase/decrease), 1990-1996;
Total economic enterprises, in terms of number of units and of workers (increase/decrease), 1990-1996;
Education and health services by province as of June 2001.
Annual statistical data provided by the Liguria Regional Statistical Office provides information to economic, social and cultural enterprises and organizations as well as to the public administration for their programme and planning interventions and for the evaluation of the effects of these interventions.
The most important topics and related indicators used in regional and coastal planning and management are the following:
1. Population
 Demographic (=
natural and migratory) balance of resident population, 1991-2000
Demographic (=
natural and migratory) balance of resident population, 1991-2000
Resident population
by sex and class of age (1 year, 2 years, 3 years, 4 years, 5 years,
...)
Resident population
by sex and class of age (0-5 years, 6-10 years, 11-15 years,....)
Resident population
by sex and class of age (0-14 years, 15-64 years, 65 years and over)
Change of residence
and resident population by sex and municipality
Migratory movement
of resident population by provenance and destination, by sex and
municipality
Foreign resident
citizens by geographical area of citizenship and province as of 1 January
2001
Foreign resident
population by provenance and sex as of 1 January 2001
Marriages by rite
(civil, religious) and province
Major population
indicators by province:
2. Environment and Territory
Municipalities,
territorial surface, resident population and density, per province, year
2000
Territorial surface
(in hectares) and altitude of municipalities
Rainfall: quantity
(in millimetres) and number of rainy days in selected weather stations
Monthly rainfall (in
millimetres) in selected weather stations, year 2001
Number of rainy days
per month in some weather stations, year 2001
Condition/quality of
coastal waters (coastal length in kilometres) by province Total length of
coastline
Coastline where
bathing is prohibited, either permanently or temporarily because of pollution or
other reasons
Coastline where
bathing is allowed
Protected natural
areas (in hectares) as on 31 July 2002 by province
Environment
monitoring stations of provincial network and ENEL by typology and
province
Concentration of
sulfate bioxide recorded by some monitoring stations
Forest fires
(surface in hectares) and related damage by province in year 2000 Forest fires
by cause and province in year 2000
Urban waste
collection in tonnes by province
Diversified and
selective waste collection by province
Number of vehicles
(from the public registry) by category and province
3. Health
Number of hospital
beds, number of hospitalized persons and number of days of hospitalization, by
hospital
Staff serving in the
regional health system by local health service and hospital
Ambulance services
and access to and use of the first aid service
Doctors and medical
expense by local health service
Drug addicts and
therapeutic groups by local health service
Assistance to
elderly people, number of assisted persons, days of hospitalization and number
of hospital beds
Day care centres,
residential facilities by local health service
Home care
services
Assistance to
psychiatric patients by local health service
Assistance to
disabled persons and available services (ambulatory, home assistance and day
centres)
Causes of death, by
age of resident population and sex
4. Education
Kindergarten:
institutions, number of classes, number of children
Primary schools:
schools, number of classes, number of students
Middle schools:
schools, number of classes, number of students
Secondary schools:
institutes, number of classes, number of students
University: courses
and number of students
Vocational
education: courses and number of students
5. Employment
Population 15 years
old and over by employment status (employed, unemployed), sex and
province
Population and
labour force by age and sex
Number of employed
by age and sex
Number of employed
by dependency status (dependent, independent), economic sector, sex and
province
Number of employed
by full-time/part-time employment, sex and economic sector
Percentage of
employment with work related accidents and professional diseases by
province
Number of pensions
by age and employment category
6. Agriculture
Number of farms,
total farm area (in hectares) by category of farming and province
Number of farms with
animal husbandry by total surface and province
Number of cattle by
animal category, total surface and province
Average area of
farms by type of farm, farm area and province
Number of the family
farm workers and hired farm workers
Number of farms
using mechanization by type of ownership
7. Industry
Change of location
of industrial and construction companies by sector of activity and
province
Consumption of
electricity by sector of economy and by province
8. Commerce
Number of retail
shops and their distribution
Number of
supermarkets and their distribution
9. Tourism
Number of hotels by
category and province
Arrivals, presence
and average occupancy of hotels by Italian and foreign tourists, by
province
Presence of foreign
tourists in hotels by country of origin and province
10. Transport
Road network by kind
of road
Railway
network
Commercial maritime
traffic
Number of motorboats
by category and length
11. Credit
Bank network and
their branch network
Distribution of bank
deposits by locality and economic activity of customer (public administration,
companies and private households)
Nature reserves, parks and protected areas also form part of the Liguria Region planning activities. Among them is the Cinque Terre National Park, established under the chapter on rural space of the Regional Territorial Plan. The rehabilitation and management of some rural buildings and the maintenance of the traditional wine terraces at risk of soil erosion due to a discontinuation of wine growing activities are among the other interesting initiatives taken by the Plan in recent years.
At local level, an interesting example for participatory planning is the Piano di Azione Locale (Local Action Plan) approved in June 2002 by the Municipality of Vernazza, which forms part of the Cinque Terre area. The Local Action Plan was developed and is being implemented jointly with the Liguria Region and the technical assistance of the so-called Laboratorio Mediterraneo per un Turismo Sostenibile (Mediterranean Centre for Sustainable Tourism) of the Centro V.I.A. Italia, a consortium promoted by the European Commission in agreement with the Italian Ministry of Environment for the diffusion of the evaluation of environmental impact.
The objective of the Local Action Plan is to promote self-sustainable development of the municipality of Vernazza. This is to be achieved by making the citizens of Vernazza more aware of the problems surrounding sustainable development in the municipality; by encouraging the local population to participate in the process of tackling the environmental problems of the area; and by elaborating together with the local population commonly agreed objectives, action plans and programmes for the improvement of the socio-economic conditions and well-being of the local community.
With a view to elaborating commonly agreed objectives, action plans and programmes, a committee composed of representatives of the municipality, the technical staff and the civil service promoted a series of discussions involving the local population on topics such as:
Environment, tourism, transport, health services, local culture, land use and construction rules and activities;
Local values and traditions, agriculture, landscapes, the sea;
Natural resources, energy, water, impact of waste from industrial activity and human settlement on the environment.
During these discussions, the following key indicators to be used for coastal regional planning and management were identified:
Among the most important demographic and social concerns of the municipality of Vernazza, as identified by the Rapporto sullo stato dell’ambiente 2000 (Report on the State of the Environment 2000), are the decline and rapid aging of the population in the municipality.
By 1999, the population of the municipality of Vernazza had declined to only 1 117 inhabitants.
Table 1 shows the high percentage of older people in the municipality of Vernazza as compared to other municipalities, the province of La Spezia and the region of Liguria.
The decline and aging of the population is also expressed by three demographic indicators - the aging index, the old age index and the dependency rate, which are shown in Table 2.
The aging index reflects the ratio of old people (65 years and over) to the total population. The old age index reflects the ratio of old people (65 years and over) to young people (0-14 years). Table 2 shows that for both these indices, the figures for Vernazza are considerably higher than for the province and the region as a whole.
|
TABLE 1 |
|||||||
| |
AGE OF POPULATION (YEARS) |
||||||
|
0-14 |
15-29 |
30-44 |
45-59 |
60-74 |
75+ |
TOTAL |
|
|
Municipality of Vernazza |
9% |
12% |
21% |
19% |
24% |
15% |
100% |
|
Municipality of Riomaggiore |
6% |
14% |
18% |
21% |
24% |
15% |
100% |
|
Municipality of Monterosso |
10% |
16% |
20% |
19% |
22% |
13% |
100% |
|
Province of La Spezia |
10% |
16% |
22% |
20% |
20% |
12% |
100% |
|
Region of Liguria |
10% |
16% |
22% |
20% |
20% |
11% |
100% |
|
TABLE 2 |
|||||
| |
AGING INDEX |
OLD AGE INDEX |
POPULATION DEPENDENCY RATE |
||
|
Total |
Young |
Old |
|||
|
Municipality of Vernazza |
0.31 |
3.61 |
0.68 |
0.15 |
0.53 |
|
Province of La Spezia |
0.24 |
2.39 |
0.55 |
0.16 |
0.39 |
|
Region of Liguria |
0.24 |
2.36 |
0.53 |
0.16 |
0.37 |
The dependency rate reflects the ratio of the typically non-economically active age groups of 0-14 years and 65 years and over to the presumed economically active population. Again, the figure for Vernazza is higher than for the province and the region as a whole.
Other major problems with which regional coastal planning and management in the municipality of Vernazza has to deal are:
enemployment problems reflected by a high percentage of people (26 percent) who must seek work outside the Cinque Terre sub-region;
environmental problems created by a massive seasonal presence of tourists, particularly from April to October;
transport and parking problems;
marginalization of agricultural and fishing activities, the abandonment of traditional wine terraces and declining demand for traditional local products;
insufficient medical assistance;
lack of home care services for elderly and disabled people.
As a result, a so-called calendar of activities was elaborated for the period 2002-2003 and 2004-2005 indicating the action proposed and the promoters and parties responsible for a particular activity.
The priority activities proposed are:
promotion/establishment of ecotourism information centres;
promotion of environmental information campaigns for tourists;
improvement of the local railway transport system;
creation of local market places outside of urban centres;
use of helicopters for medical emergency services in remote coastal areas;
provision of home care assistance to aged and disabled persons;
promotion of trade fares for typical local products;
public construction of new residential flats for residents, respecting local architectural styles;
provision of facilities and tax rebates to those renting flats to resident young couples with the objective of reversing the present demographic trend towards an aging population;
promotion/organization of training courses for new cultivation techniques, bio-agriculture and wine growing;
creation of an “Environment Fund” partly sustained by tourist business-related commercial income;
elaboration of stricter maritime traffic regulations;
tightening of rules for entry of motor vessels into small ports;
better control of wastewater disposal of coastal towns;
promotion of biological compost production, collection of vegetal oils and introduction of selective waste collection;
promotion of energy and water saving.
The major difficulties encountered when implementing the above activities are the rather limited human and financial resources available for the implementation of the Local Action Plan: The municipality of Vernazza is very small and its revenue, because of the problems described above, is very limited.
For this reason, the overall management of the Local Action Plan of Vernazza is now entrusted to the recently established Cinque Terre National Park, which was formed in the context of the implementation of “Agenda 21” with considerable financial support from the Ministry of Environment of the Italian Government. Similar local action plans are now being evolved for other municipalities in the Cinque Terre.
Most of the activities foreseen in the 2002-2003 calendar are being implemented but have not been yet evaluated.
|
[35] State of Washington,
1990. [36] Planning Association of Washington, 1999. [37] State of Washington, 1990. [38] Planning Association of Washington, 1999. [39] Planning Association of Washington, 1999. [40] State of Washington, 1997a. [41] Lowe, 2001. [42] State of Washington, 1997b. [43] Growth Management Planning Council and Office of Management and Budget, 2002 p.4. [44] Growth Management Planning Council and Office of Management and Budget, 2002 p. iv. [45] Washington State Office of Community Development, 2000 p. 66. [46] Growth Management Planning Council and Office of Management and Budget, 2002 p. iv. [47] R. Curran, personal communication, 2003. [48] R. Curran, personal communication, 2003. [49] I. Melmore, personal communication, 2003. [50] City of Olympia, 2003. [51] Pierce County, 1998. [52] Sustainable Community Roundtable, 1998. [53] Sustainable Seattle, 1998. [54] Puget Sound Water Quality Action Team, 2000. [55] Puget Sound Water Quality Action Team, 2000. [56] Washington Department of Health, 2002. [57] U. S. Food and Drug Administration, 1999. [58] The Health of Puget Sound is printed as a newspaper insert and distributed to hundreds of thousands of newspaper subscribers. [59] Puget Sound Water Quality Action Team, 2002. [60] Puget Sound Water Quality Action Team, 2000. [61] State of Washington, 1992. [62] Pacific Fishery Management Council, 2000. [63] Pacific Marine Conservation Council/Ecotrust, 2003. [64] Pacific Marine Conservation Council/Ecotrust, 2003, p.7. [65] Pacific Marine Conservation Council/Ecotrust, 2003, p. 19. [66] Pacific Marine Conservation Council/Ecotrust, 2003, p. 20. |
![]()
![]()
![]()
 ECONOMIC
DEVELOPMENT
ECONOMIC
DEVELOPMENT