![]()
![]()
![]()
4.1 Data collection
Fisheries statistics used for estimating annual fish production, species composition, effort, etc., in inland African fisheries are collected by research officers and assistants from governmental research institutes. The methods are usually quite similar and originate from proposals from the FAO in the 1970’s. The techniques used are mainly experimental gillnet surveys (GNS) for biological parameters and fishery independent data, frame surveys (FS) for inventories of all fish production factors, and catch and effort surveys (CAS) for sampled daily catch and effort data. The collection of CAS data typically follows a stratified simple random design, where intensity of sampling depends on available manpower and economical resources. The precision, accuracy, usefulness, and cost-efficiency of these methods have sometimes been questioned (Orach-Meza, 1991) and reliable landing statistics is a notorious problem in many African inland fisheries. However, few other sampling alternatives have been developed or tried out.
In Lake Bangweulu the Department of Fisheries (DoF) has employed for many years the above mentioned data collection methods and sampling design. Multi-mesh experimental gillnet surveys, operated by DoF, were used for biological data collection in the open waters since 1971 and CAS survey rounds were done to collect catch-effort data. However, the sample frequency varied strongly over the years depending on availability of funds. The amount of fish of different species caught in the GNS was inadequate to allow for a realistic assessment of the fish stocks in the swamps. In addition, the structure and composition of the artisanal catches was not reflected in the data collected and the time series of catch and effort data from the CAS surveys was too short and contained too little contrast to allow for meaningful analysis.
It was therefore decided to carry out an independent length-based stock assessment of the most important stocks. To obtain sufficient data within a limited period, a number of full-time professional fishers living in the swamps were selected and engaged to carry out part of the sampling, in parallel with the already established monthly experimental GNS by the DoF. Each fisher would receive a basic fee per month for measuring and recording all his catches by species, length, mesh size and sampling area. Some would utilize their own gear (in order to get a representative picture of the fishing pattern) and some would be issued with experimental gillnets (in order to establish growth and mortality parameters). All the fish caught would belong to the fisher and he would be free to fish where and when he wanted, as long as he recorded the catches. This approach of engaging local fishermen in scientific fisheries data collection is to our knowledge new and had never been tried out before (Ticheler, Kolding and Chanda, 1998).
Two main sampling areas in the central swamps were identified: Bwalya Mponda and Nsamba (Figure 1). In these areas all common swamp habitats were well represented, and it was assumed that the status of the stocks in these areas would represent the situation in most parts of the swamps. In each area five fishermen were engaged in the sampling. Three of these were issued with a standard fleet of experimental gillnets (mesh sizes spanning from 25 mm to 140 mm with 12.5 mm increments, i.e. altogether 10 mesh panels), which they should employ concomitantly with their own nets or methods (e.g. gillnets, seines, or “kutumpula”). They were free to choose when they set the experimental nets as long as they were utilizsed on a frequent regular basis. The two remaining fishermen were chosen among those who used kutumpula or seines. A detailed description and discussion of the “Fishermen Data Collection Method” (FDC) is given in Ticheler, Kolding and Chanda (1998).
Data from the 13 most abundant and commercially important species were selected and analysed with respect to gear selectivity, growth rates, spawning frequency, mortality rates, and present and long-term yield assessment. The yield analysis has concentrated on gillnets, kutumpula nets and seines, which are the most important fishing gear in the perennial swamps. Weirs, in connection with small meshed (3-10 mm) fish traps, are another important fishing method, which are mainly (90 percent) found in the seasonal floodplains. For logistical reasons weirs could therefore not be included in this study (Ticheler, Kolding and Chanda, 1998). A separate detailed analysis of the weir fishery, which catch a broader size range and higher proportion of smaller specimens than all the other gears, is given in Chanda (1998).
The standard experimental gillnets (25 to 140 mm) used by DoF were not representative for length groups smaller than 10-12 cm TL for any of the examined species, and they were also not representative for the artisanal catch composition. In order to estimate growth and mortality parameters for most of the smaller species, which are important in the Bangweulu swamps, the sampling design was extended by supplying five of the fishermen with small-meshed experimental monofilament gillnets (the Swedish Lundgren survey types) alongside the experimental standard gillnets.
4.2 Length-frequency data
Nearly one million single fish measurements from various gears were recorded and computerizsed covering a period of two years from July 1994 to July 1996 (Table 3).
TABLE 3. The number of individual fish records and fish species collected in different fishing gears between July 1994 and July 1996 (except the Lundgren nets, which covers the period June 1995 to July 1996). Local fishermen collected all data except DoF experimental gillnets.
|
Gear/method |
No. of records |
No. of species |
|
DoF experimental gillnets |
16 528 |
37 |
|
Experimental gillnets |
264 589 |
37 |
|
Lundgren nets |
102 602 |
36 |
|
Artisanal gillnets |
233 717 |
34 |
|
Seine fishery |
290 736 |
34 |
|
Kutumpula fishery |
37 810 |
21 |
|
|
945 982 |
|
4.3 Frame survey data
TABLE 4. Total number of fishing gears by type and mesh size for the Bangweulu swamps and the overall fishing effort used in calculating catch volumes by length group and gear type. Data from frame survey 1992, kutumpula survey 1996. Data from the weir fishery (Chanda, 1998) are included for comparison but not used in this study.
|
Total number by gear type |
||||
|
Mesh size (mm) |
Gillnets |
Kutumpula nets |
Seines* |
Weir traps |
|
3 |
|
|
|
3 869 |
|
4 |
|
|
|
8 358 |
|
6 |
|
|
|
2 322 |
|
8 |
|
|
|
387 |
|
10 |
|
|
|
|
|
25 |
534 |
17 |
53 |
|
|
38 |
6 719 |
68 |
178 |
|
|
50 |
4 233 |
135 |
49 |
|
|
63 |
1 260 |
643 |
|
|
|
76 |
554 |
74 |
|
|
|
89 |
136 |
- |
|
|
|
102 |
- |
- |
|
|
|
114 |
- |
|
|
|
|
127‡ |
255 |
|
|
|
|
140 |
- |
|
|
|
|
Total |
13 691 |
937 |
280 |
15 477 |
|
Effort |
80 |
100 |
160 |
|
*mesh size of the bag.
‡ The number of 127 mm gillnets has probably more to do with availability of these nets on the market than with specific preference by fishers for these meshes.
† Effort in number of gear settings per year. For gillnets it is 160*0.5 to adjust for catchability (see methods of analysis).
Data from the Frame Survey of 1992 (Ticheler and Chanda, 1993) and an additional kutumpula survey in 1996 has served as input for the calculation of total annual catch volumes by species, by gear category (artisanal gillnets, kutumpula nets and seines) and by length group (Table 4). During the traditional frame survey no difference was made between stationary gillnets and “kutumpula”. However, due to clear difference in the species composition in the kutumpula and stationary gillnet catches (Kolding, 1995; Tables 6 and 7), an additional kutumpula survey was carried out in the swamps where the proportion of all gillnets which is actually being used for kutumpula fishing was obtained (Table 4).
4.4 Methods of analysis
All recorded data were stored in PASGEAR (Kolding, 1996). Most of the calculations, tables and figures were performed using a combination of PASGEAR (ver: 15.10.96) and FiSAT (ver: 1.01, Gayanilo, Sparre and Pauly, 1996; Gayanilo and Pauly 1997). The general approach was based on classical length-structured stock assessment methodology with long-term steady state forecasting (e.g. Sparre and Venema, 1998) using the following steps:
1) Estimation of basic vital parameters (growth and natural mortality) from the experimental gillnet data. For all species the ELEFAN I module implemented in FiSAT was used to calculate parameters for the von Bertalanffy growth function (VBGF) (Gayanilo, Sparre and Pauly, 1988). Total mortality (Z) was calculated from a linearized length-converted catch-curve analysis and natural mortality (M) was calculated from Pauly’s (1980) empirical formula with an input Temperature (T) of 23.5 degrees centigrade (estimated mean annual water temperature in the Bangweulu system (Evans, 1978).
2) The growth and natural mortality parameters were used to estimate fishing mortality by length group and overall population sizes from length-based cohort analysis (Jones and van Zalinge, 1981; Jones, 1984; Lassen and Medley, 2001) on the artisanal fishery.
3) Finally a yield analysis and long-term predictions were performed using a length based Thompson and Bell model (Thompson and Bell, 1934). This model combines features of Beverton and Holt’s Yield per Recruit model with those of VPA, which it inverts. The basic assumptions are based on a steady state system so that all input parameters, except fishing mortalities, are constants and do not change with fishing effort. Growth parameters, natural mortality, population sizes (recruitment), and fishing mortality by length group estimated in the earlier steps were used as inputs. The Thompson and Bell model was applied for each species in the gillnet, kutumpula, and seine fishery separately (single-species, single gear), as well as on the combined fishery with pooled catches (multi-species and multigear).
The conditions for the validity of this approach are:
1) that the selectivity of the gears used for experimental fishing is such that the derivation of vital parameters is valid, i.e. that the sampled data do represent the population structures, and
2) that it is possible to derive overall catch volumes of the artisanal fishery and that overall length composition data for the artisanal fishery is available.
4.5 Selectivity
The first of these conditions was tested by gillnet selectivity analysis of the experimental catches. Selectivity is a quantitative expression of the probability of capture of a certain size of fish in a certain size of mesh. Indirect methods (i.e. based on catch data alone without a priori knowledge on the underlying distribution) for estimating this probability, as in this study, are all based on the assumption that all the fish have the same probability of encountering the gear. This may be a dubious assumption as the smaller fish (specimens or species) normally have a smaller action range than larger fish. This uncertainty, however, is not possible to quantify without independent information on the population sizes and composition. A further assumption of the indirect methods is that all mesh sizes have the same efficiency at their individual “peak length-class”, although with the same reasoning as with the previous assumption, there are indications that the relative fishing efficiency rises with mesh size. Finally, it is a matter of choice which statistical model is used to represent the selection curves for species that also have some degree of entanglement. The statistical models and the method are described in Millar and Holst (1997) and Millar and Fryer (1999) and are implemented in PASGEAR.
4.6 Derivations of overall catch volumes by length groups
The selected fishermen participating in the data collection were encouraged to use their own gillnets. However, it turned out that the participants only used mesh sizes 25, 38, 50 and 102 mm. Therefore their data did not cover the full range of mesh sizes found in the artisanal fishery (Table 4). The overall artisanal catch volume in all gillnets broken down by length groups for Jones’ length-based cohort analysis was therefore calculated from the following assumptions: Mean average catch per unit effort (CPUEi) of each mesh sizei per species in the experimental nets were calculated. Overall annual catch per species was calculated from:
Total catch = S(CPUEi #nets of mesh sizei · total effort)
where total number of netsi and total effort in days fishing were obtained from the frame survey in 1992 and the additional kutumpula survey in 1996. Overall catches of each species per length groupj were calculated as proportions from total catch (see Kolding, Ticheler and Chanda, 1996b for details). A comparison of CPUE in experimental and artisanal gillnets included in the sampling programme revealed that the artisanal nets were less effective then experimental nets, probably due to the general state of the nets, their smaller size, and their age. Based on the overall average differences an estimated conversion factor of 0.5 for CPUE from the experimental to a “general” artisanal net was therefore applied (Kolding, Ticheler and Chanda, 1996b). No conversion factors were applied for seines or kutumpula nets as the data originated from the gear used in these methods.
4.7 Fishing effort and fishing pattern
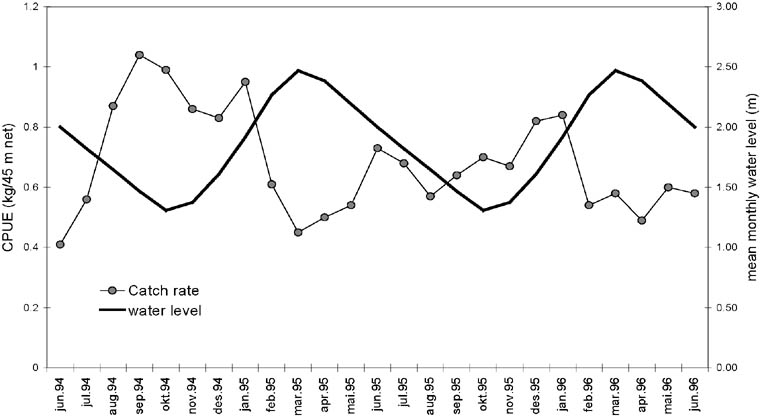
The estimated total annual fishing effort in number of days fishing for stationary gillnets and seines was based on data on seasonal and weekly fishing activities from the Frame survey (Ticheler and Chanda, 1993). In Bangweulu catch rates fluctuate seasonally and are inversely correlated with water levels (Figure 4). During the high water period (January to June) the fish will tend to disperse into the floodplains for feeding and breeding, while the densities in the perennial swamp will increase during the low water period (July to December). Such inverse relationship between water levels and catch rates is a general trend found in floodplain fisheries. The peak season (more than 50 percent of fisherman actually fishing) for the whole fishery is from May to November. For the different areas small differences were recorded. On the islands the peak season starts in April and in the swamps it continues up to December. Farming is concentrated (with more than 50 percent of fishermen farming) in the months December to March, except for the swamps where farming is mainly done from January to April. The frame-survey revealed that on average fishermen fish for six months a year (i.e. 26 weeks), and during that period for approximately for 6.2 days per week (i.e. 160 days per year per fisher). The effort employed in kutumpula fishing differs from the stationary gillnet fishing. A popular Bemba saying amongst the Unga fishers in the swamps is “ngawatemwa ukusakila kuti wafilwa ukupela umukashi obe ifumo”, which literally means “a kutumpula fisher will fail to make his wife pregnant”. This is because kutumpula fishing is much harder compared to stationary gillnet fishing and this is also the reason why people say kutumpula is done less often as compared to stationary gillnet fishing. Although it is not exactly known, this study estimated kutumpula effort at 4.0 days per week in the fishing season, i.e. 100 days per year.
FIGURE 4. Mean monthly catch rate of all species (kg/45 m net set) in the experimental nets from June 1994 to June 1996 plotted with mean annual water level fluctuations (from the period 1955-1995). The fluctuations are significantly inversely correlated (r = - 0.65).
The fishery is highly dominated by small meshed nets: all the weir traps and 50 percent of the other gears are less than the legal limit of 51 mm stretched (Table 4, Ticheler and Chanda, 1993; Chanda, 1998). During the 1996 “Kutumpula” survey 809 kutumpula fishers were interviewed and information on the use of 8 105 nets used in the swamps was collected. This is approximately 50 percent of the total number of fishermen covered during the 1992 frame survey. The total number of kutumpula nets is small compared to the total number of stationary gillnets in the swamps (6.8 percent), but for the most commonly used mesh in kutumpula fishing (63 mm), these nets account for one third of all gillnets (Table 4). Kutumpula nets in general have larger mesh sizes than the nets used in stationary gillnet fishing.
4.8 Fish species selection for detailed analysis
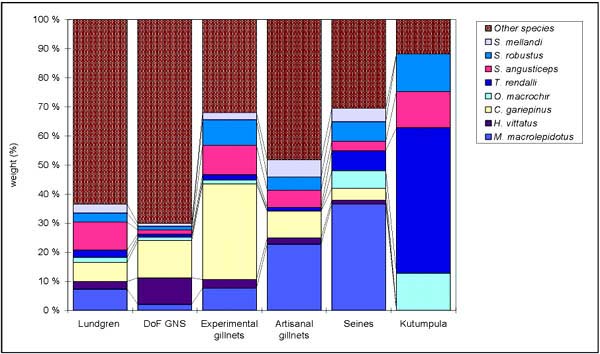
Thirteen species were selected for a more detailed analysis of growth, mortality and yield. The first eight were well represented in the experimental gillnets. These were Marcusenius macrolepidotus, Hydrocynus vittatus, Clarias gariepinus, Oreochromis macrochir, Tilapia rendalli, Serranochromis angusticeps, Serranochromis robustus and Serranochromis mellandi. The last five were small species chosen from the Lundgren nets: Barbus paludinosis, Barbus trimaculatus, Petrocephalus catostoma, Schilbe mystus and Tilapia sparrmanii. The main criteria for selecting these 13 fish species for a detailed analysis were a) their importance in the artisanal fishery, either by weight or number, and b) the possibility of deriving growth parameters from the data available. The selected species, however, together represent a large variation in biology, distribution and sizes of the species found in the fishery and the first eight alone contribute nearly 75 percent of the total yield (Figure 5 and Table 12).
FIGURE 5. The contribution, weight percentage, of the first eight selected species in the experimental gillnets to the total catch in the different fishing gears.
![]()
![]()
![]()