![]()
![]()
![]()
|
Afghanistan |
Mean |
1970-2001 |
|||||||
|
1970-1979 |
1980-1989 |
1990-1995 |
1996-2001 |
Mean |
Min. |
Max. |
Variation (%) |
||
|
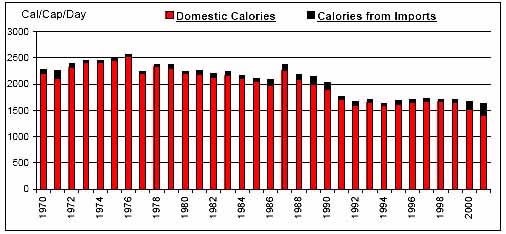
Per Caput Consumption (Cal/Day) |
2383 |
2201 |
1747 |
1694 |
2078 |
1631 |
2557 |
15 |
|
|
Imports / Consumption (%) |
Wheat |
4.25 |
5.26 |
7.50 |
14.62 |
7.12 |
0.14 |
39.72 |
119 |
|
Coarse Grains |
0.00 |
N/A |
0.08 |
0.63 |
0.13 |
0.00 |
2.21 |
356 |
|
|
Rice |
0.45 |
1.50 |
11.45 |
32.21 |
8.80 |
0.00 |
59.73 |
174 |
|
|
Dairy |
0.57 |
1.88 |
1.30 |
0.26 |
1.06 |
0.15 |
4.04 |
84 |
|
|
Meat |
N/A |
0.47 |
0.09 |
N/A |
0.17 |
0.00 |
1.38 |
197 |
|
|
Sugar |
29.64 |
48.67 |
50.43 |
58.27 |
44.85 |
18.41 |
67.65 |
32 |
|
|
Fruits and Vegetables |
1.34 |
0.72 |
0.64 |
0.80 |
0.91 |
0.09 |
2.40 |
64 |
|
|
Oils |
12.08 |
28.70 |
20.29 |
19.01 |
20.11 |
3.55 |
42.27 |
48 |
|
|
Per Caput Calories from Imports (Cal/Cap/Day) |
57 |
85 |
72 |
103 |
77 |
29 |
231 |
59 |
|
|
Aid + Commercial Food Import Bill (US$ 000) |
48,674 |
106,708 |
95,938 |
112,730 |
87,682 |
16,698 |
186,991 |
51 |
|
|
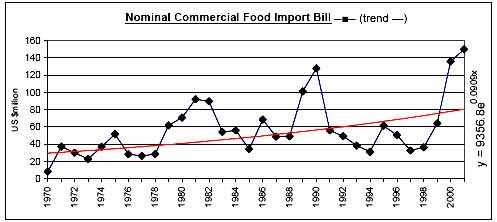
Commercial Food Import Bill (US$ 000) |
33,195 |
66,468 |
60,806 |
78,283 |
57,224 |
8,201 |
150,094 |
59 |
|
|
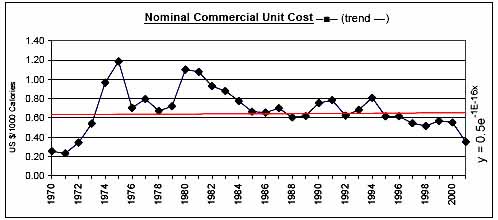
Commerical Unit Cost (US $/1000 calories) |
0.64 |
0.80 |
0.71 |
0.53 |
0.68 |
0.23 |
1.19 |
33 |
|
|
Commercial Food Import Bill / GDP (%) |
0.14 |
0.25 |
0.27 |
0.25 |
0.22 |
0.05 |
0.59 |
55 |
|
|
Comm. Fd. Imp. Bill / Total Merchandise Imp. Bill (%) |
11.67 |
6.77 |
11.72 |
13.44 |
10.48 |
2.86 |
23.09 |
52 |
|
|
Comm. Fd. Imp. Bill / Total Merchandise Exp. Bill (%) |
16.46 |
13.83 |
33.84 |
66.55 |
28.29 |
6.03 |
150.09 |
105 |
|
|
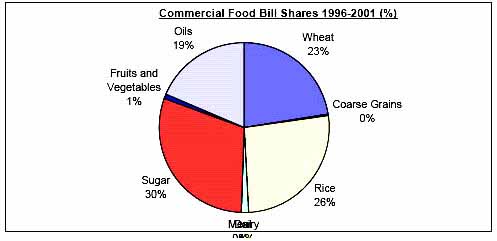
Commercial Food Value Bill Shares (%) |
Wheat |
13.48 |
7.81 |
23.12 |
22.62 |
15.23 |
0.00 |
70.47 |
145 |
|
Coarse Grains |
N/A |
N/A |
0.11 |
0.21 |
0.06 |
0.00 |
0.68 |
317 |
|
|
Rice |
1.24 |
3.12 |
14.78 |
26.30 |
9.07 |
0.00 |
33.84 |
124 |
|
|
Dairy |
2.97 |
5.91 |
7.15 |
1.39 |
4.37 |
0.06 |
11.87 |
72 |
|
|
Meat |
N/A |
1.77 |
0.70 |
N/A |
0.69 |
0.00 |
4.69 |
171 |
|
|
Sugar |
49.69 |
40.85 |
27.95 |
30.14 |
39.18 |
5.53 |
76.59 |
49 |
|
|
Fruits and Vegetables |
3.93 |
3.33 |
2.54 |
0.63 |
2.86 |
0.00 |
9.37 |
77 |
|
|
Oils |
28.69 |
37.22 |
23.64 |
18.72 |
28.54 |
3.83 |
65.46 |
48 |
|
|
|
|
|
|
|
|
|
|
![]()
![]()
![]()