![]()
![]()
![]()
|
Angola |
Mean |
1970-2001 |
|||||||
|
1970-1979 |
1980-1989 |
1990-1995 |
1996-2001 |
Mean |
Min. |
Max. |
Variation (%) |
||
|
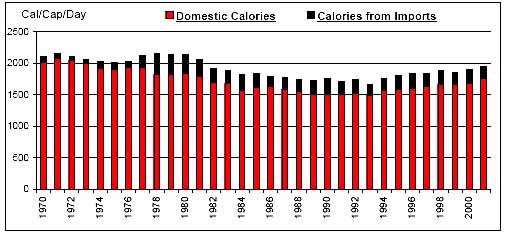
Per Caput Consumption (Cal/Day) |
2089 |
1867 |
1737 |
1878 |
1914 |
1667 |
2161 |
8 |
|
|
Imports / Consumption (%) |
Wheat |
89.21 |
97.19 |
98.17 |
98.39 |
95.10 |
85.43 |
98.84 |
5 |
|
Coarse Grains |
7.15 |
20.95 |
28.71 |
20.43 |
17.99 |
0.00 |
41.48 |
62 |
|
|
Rice |
33.70 |
88.55 |
86.23 |
64.45 |
66.46 |
1.82 |
97.73 |
46 |
|
|
Dairy |
23.50 |
51.23 |
35.67 |
18.01 |
33.42 |
8.80 |
68.14 |
51 |
|
|
Meat |
6.92 |
28.49 |
23.53 |
26.57 |
20.46 |
0.41 |
35.41 |
56 |
|
|
Sugar |
4.38 |
16.43 |
21.84 |
23.90 |
15.08 |
0.00 |
28.70 |
58 |
|
|
Fruits and Vegetables |
2.64 |
4.60 |
6.40 |
6.87 |
4.75 |
0.20 |
10.65 |
56 |
|
|
Oils |
12.30 |
31.66 |
30.59 |
30.47 |
25.19 |
1.23 |
42.25 |
49 |
|
|
Per Caput Calories from Imports (Cal/Cap/Day) |
143 |
226 |
215 |
214 |
196 |
70 |
336 |
36 |
|
|
Aid + Commercial Food Import Bill (US$ 000) |
94,228 |
260,768 |
285,822 |
274,152 |
215,931 |
19,916 |
387,590 |
51 |
|
|
Commercial Food Import Bill (US$ 000) |
79,420 |
222,265 |
226,399 |
204,698 |
175,107 |
17,498 |
320,117 |
51 |
|
|
Commerical Unit Cost (US $/1000 calories) |
0.75 |
1.42 |
1.37 |
1.03 |
1.13 |
0.43 |
1.81 |
32 |
|
|
Commercial Food Import Bill / GDP (%) |
0.95 |
2.51 |
2.53 |
2.15 |
1.96 |
0.21 |
4.04 |
52 |
|
|
Comm. Fd. Imp. Bill / Total Merchandise Imp. Bill (%) |
10.36 |
17.05 |
14.12 |
8.93 |
12.88 |
4.45 |
23.31 |
45 |
|
|
Comm. Fd. Imp. Bill / Total Merchandise Exp. Bill (%) |
8.82 |
11.24 |
6.47 |
4.43 |
8.31 |
2.48 |
21.54 |
62 |
|
|
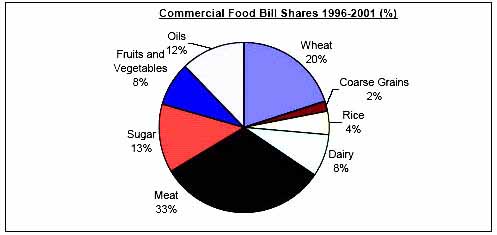
Commercial Food Value Bill Shares (%) |
Wheat |
31.29 |
8.47 |
10.14 |
20.09 |
18.09 |
3.19 |
54.33 |
73 |
|
Coarse Grains |
6.52 |
4.59 |
0.82 |
1.98 |
3.99 |
0.00 |
25.24 |
143 |
|
|
Rice |
6.15 |
8.21 |
10.97 |
4.37 |
7.36 |
0.37 |
14.83 |
51 |
|
|
Dairy |
14.39 |
20.48 |
15.73 |
8.07 |
15.36 |
4.30 |
29.69 |
41 |
|
|
Meat |
8.16 |
30.94 |
30.85 |
32.00 |
24.00 |
1.14 |
44.58 |
54 |
|
|
Sugar |
7.43 |
9.09 |
14.31 |
12.99 |
10.28 |
0.00 |
33.40 |
64 |
|
|
Fruits and Vegetables |
13.14 |
7.48 |
7.23 |
8.24 |
9.35 |
0.86 |
23.30 |
61 |
|
|
Oils |
12.92 |
10.74 |
9.96 |
12.26 |
11.56 |
2.09 |
21.75 |
40 |
|
|
|
|
|
|
|
|
|
|
![]()
![]()
![]()