![]()
![]()
![]()
|
Bangladesh |
Mean |
1970-2001 |
|||||||
|
1970-1979 |
1980-1989 |
1990-1995 |
1996-2001 |
Mean |
Min. |
Max. |
Variation (%) |
||
|
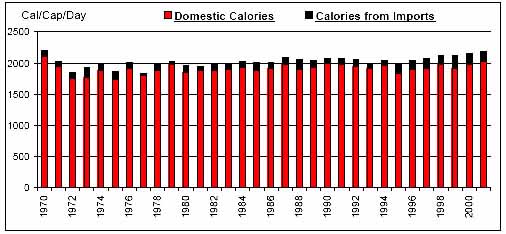
Per Caput Consumption (Cal/Day) |
1971 |
2012 |
2042 |
2117 |
2025 |
1843 |
2203 |
4 |
|
|
Imports / Consumption (%) |
Wheat |
84.39 |
60.15 |
52.38 |
47.22 |
63.84 |
36.63 |
96.50 |
27 |
|
Coarse Grains |
4.06 |
3.06 |
5.72 |
46.63 |
12.04 |
0.00 |
79.20 |
174 |
|
|
Rice |
1.84 |
1.37 |
0.91 |
2.49 |
1.64 |
0.06 |
6.02 |
91 |
|
|
Dairy |
7.13 |
18.03 |
11.19 |
9.75 |
11.79 |
0.76 |
24.06 |
47 |
|
|
Meat |
0.00 |
0.09 |
0.20 |
0.32 |
0.13 |
0.00 |
0.42 |
118 |
|
|
Sugar |
0.24 |
1.26 |
0.88 |
2.37 |
1.08 |
0.00 |
3.71 |
100 |
|
|
Fruits and Vegetables |
0.42 |
2.06 |
6.98 |
8.03 |
3.59 |
0.06 |
11.55 |
97 |
|
|
Oils |
26.59 |
31.65 |
51.52 |
65.74 |
40.19 |
15.91 |
71.02 |
42 |
|
|
Per Caput Calories from Imports (Cal/Cap/Day) |
96 |
105 |
103 |
166 |
113 |
33 |
214 |
34 |
|
|
Aid + Commercial Food Import Bill (US$ 000) |
309,660 |
545,797 |
589,731 |
1,110,768 |
586,174 |
147,096 |
1,628,588 |
56 |
|
|
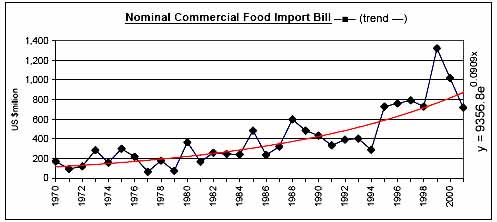
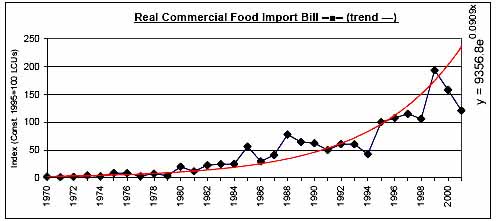
Commercial Food Import Bill (US$ 000) |
167,893 |
341,745 |
432,206 |
891,347 |
407,428 |
66,859 |
1,321,449 |
72 |
|
|
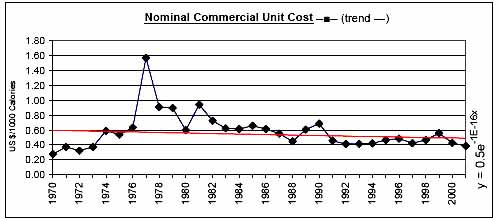
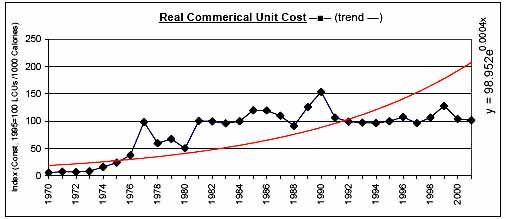
Commerical Unit Cost (US $/1000 calories) |
0.65 |
0.64 |
0.48 |
0.46 |
0.58 |
0.28 |
1.57 |
42 |
|
|
Commercial Food Import Bill / GDP (%) |
1.02 |
1.39 |
1.25 |
1.95 |
1.35 |
0.37 |
2.83 |
42 |
|
|
Comm. Fd. Imp. Bill / Total Merchandise Imp. Bill (%) |
20.66 |
14.52 |
11.41 |
12.23 |
15.42 |
5.33 |
44.11 |
50 |
|
|
Comm. Fd. Imp. Bill / Total Merchandise Exp. Bill (%) |
45.99 |
36.50 |
20.10 |
18.58 |
33.03 |
11.48 |
107.68 |
63 |
|
|
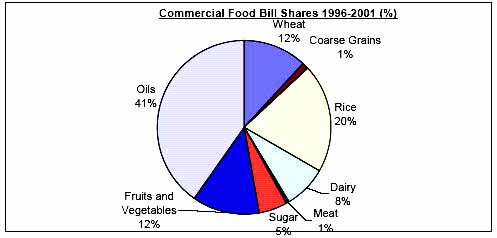
Commercial Food Value Bill Shares (%) |
Wheat |
27.70 |
19.89 |
14.08 |
11.98 |
19.76 |
0.00 |
72.42 |
91 |
|
Coarse Grains |
0.24 |
0.18 |
0.16 |
1.11 |
0.37 |
0.00 |
2.59 |
169 |
|
|
Rice |
32.55 |
17.85 |
8.74 |
20.13 |
21.16 |
0.67 |
58.82 |
77 |
|
|
Dairy |
8.35 |
17.43 |
17.12 |
8.18 |
12.80 |
0.90 |
25.74 |
59 |
|
|
Meat |
0.01 |
0.08 |
0.34 |
0.51 |
0.19 |
0.00 |
0.77 |
126 |
|
|
Sugar |
1.85 |
7.92 |
5.43 |
5.40 |
5.08 |
0.00 |
14.11 |
81 |
|
|
Fruits and Vegetables |
2.51 |
5.55 |
14.82 |
12.29 |
7.60 |
0.13 |
22.13 |
80 |
|
|
Oils |
26.79 |
31.10 |
39.30 |
40.40 |
33.03 |
8.32 |
54.63 |
37 |
|
|
|
|
|
|
|
|
|
|
![]()
![]()
![]()