![]()
![]()
![]()
|
Benin |
Mean |
1970-2001 |
|||||||
|
1970-1979 |
1980-1989 |
1990-1995 |
1996-2001 |
Mean |
Min. |
Max. |
Variation (%) |
||
|
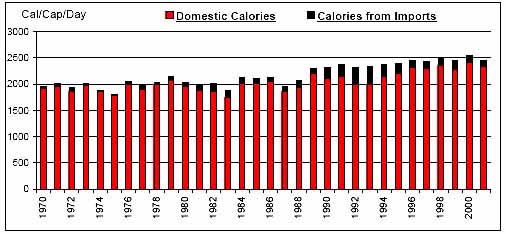
Per Caput Consumption (Cal/Day) |
1981 |
2054 |
2352 |
2469 |
2165 |
1805 |
2537 |
10 |
|
|
Imports / Consumption (%) |
Wheat |
100.00 |
100.00 |
100.00 |
100.00 |
100.00 |
100.00 |
100.00 |
0 |
|
Coarse Grains |
0.99 |
2.21 |
0.87 |
0.16 |
1.20 |
0.00 |
6.85 |
144 |
|
|
Rice |
42.18 |
80.61 |
94.19 |
65.49 |
68.31 |
21.89 |
97.18 |
33 |
|
|
Dairy |
19.81 |
32.43 |
30.99 |
45.16 |
30.60 |
13.22 |
54.95 |
35 |
|
|
Meat |
0.96 |
5.84 |
20.42 |
36.84 |
12.86 |
0.59 |
55.34 |
123 |
|
|
Sugar |
100.00 |
69.33 |
48.25 |
39.24 |
69.32 |
13.66 |
100.00 |
45 |
|
|
Fruits and Vegetables |
1.61 |
2.29 |
1.08 |
2.91 |
1.97 |
0.41 |
4.52 |
58 |
|
|
Oils |
0.55 |
1.81 |
3.07 |
3.63 |
1.99 |
0.05 |
7.29 |
98 |
|
|
Per Caput Calories from Imports (Cal/Cap/Day) |
45 |
102 |
255 |
132 |
118 |
22 |
358 |
68 |
|
|
Aid + Commercial Food Import Bill (US$ 000) |
11,250 |
38,620 |
117,691 |
97,123 |
55,862 |
4,799 |
159,795 |
80 |
|
|
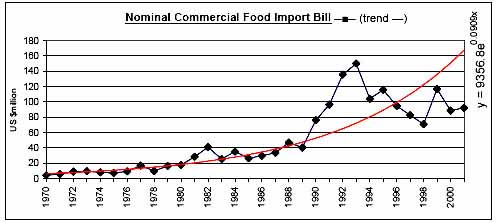
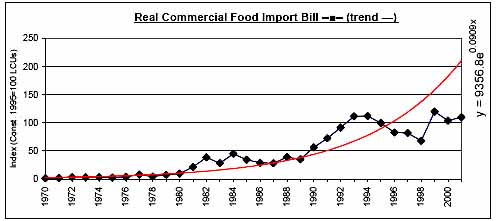
Commercial Food Import Bill (US$ 000) |
9,857 |
32,631 |
113,192 |
91,125 |
51,587 |
4,752 |
150,192 |
84 |
|
|
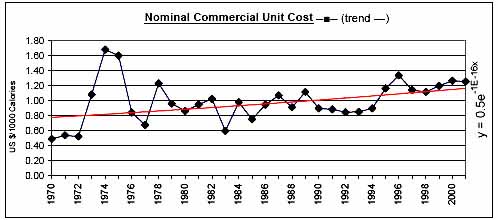
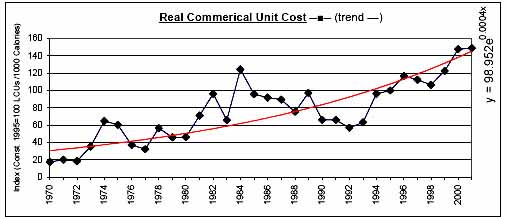
Commerical Unit Cost (US $/1000 calories) |
0.96 |
0.92 |
0.93 |
1.22 |
0.99 |
0.49 |
1.68 |
28 |
|
|
Commercial Food Import Bill / GDP (%) |
0.75 |
1.91 |
5.64 |
3.44 |
2.54 |
0.42 |
7.40 |
75 |
|
|
Comm. Fd. Imp. Bill / Total Merchandise Imp. Bill (%) |
6.66 |
10.31 |
30.15 |
13.67 |
13.52 |
3.24 |
43.57 |
73 |
|
|
Comm. Fd. Imp. Bill / Total Merchandise Exp. Bill (%) |
26.09 |
42.52 |
31.16 |
22.82 |
31.56 |
13.00 |
171.04 |
91 |
|
|
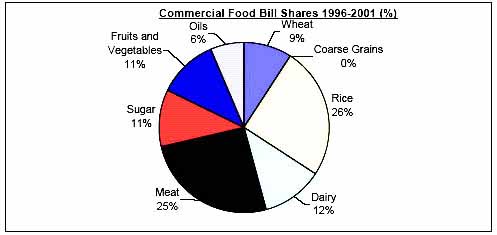
Commercial Food Value Bill Shares (%) |
Wheat |
19.38 |
25.07 |
12.90 |
9.12 |
18.02 |
0.00 |
49.18 |
67 |
|
Coarse Grains |
2.82 |
2.14 |
0.16 |
0.01 |
1.58 |
0.00 |
19.14 |
241 |
|
|
Rice |
15.64 |
23.13 |
54.27 |
24.97 |
26.98 |
0.00 |
60.41 |
66 |
|
|
Dairy |
12.85 |
9.46 |
4.84 |
11.81 |
10.09 |
3.25 |
23.34 |
44 |
|
|
Meat |
3.05 |
8.28 |
10.25 |
25.39 |
10.22 |
1.58 |
40.10 |
94 |
|
|
Sugar |
21.45 |
6.56 |
11.25 |
10.98 |
12.92 |
1.48 |
40.66 |
78 |
|
|
Fruits and Vegetables |
21.49 |
22.67 |
3.71 |
11.38 |
16.63 |
1.57 |
40.08 |
60 |
|
|
Oils |
3.32 |
2.69 |
2.61 |
6.35 |
3.56 |
0.00 |
12.34 |
71 |
|
|
|
|
|
|
|
|
|
|
![]()
![]()
![]()