![]()
![]()
![]()
|
Bhutan |
Mean |
1970-2001 |
|||||||
|
1970-1979 |
1980-1989 |
1990-1995 |
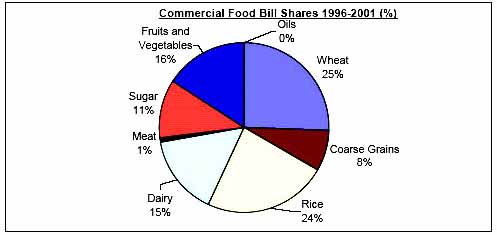
1996-2001 |
Mean |
Min. |
Max. |
Variation (%) |
||
|
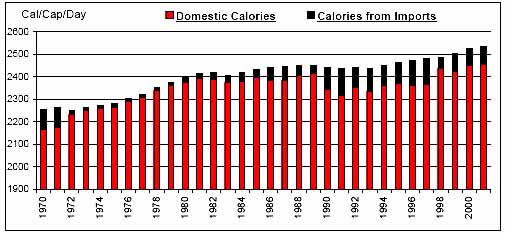
Per Caput Consumption (Cal/Day) |
2293 |
2427 |
2444 |
2500 |
2402 |
2249 |
2533 |
3 |
|
|
Imports / Consumption (%) |
Wheat |
15.44 |
26.58 |
70.39 |
49.14 |
35.54 |
0.00 |
83.90 |
81 |
|
Coarse Grains |
N/A |
N/A |
2.67 |
6.53 |
1.72 |
0.00 |
10.66 |
182 |
|
|
Rice |
4.73 |
14.81 |
33.82 |
21.86 |
16.54 |
4.23 |
37.48 |
72 |
|
|
Dairy |
8.27 |
3.33 |
6.20 |
10.00 |
6.66 |
0.00 |
10.99 |
56 |
|
|
Meat |
N/A |
N/A |
0.73 |
0.73 |
0.27 |
0.00 |
1.60 |
159 |
|
|
Sugar |
100.00 |
36.80 |
23.62 |
23.46 |
51.58 |
1.94 |
100.00 |
75 |
|
|
Fruits and Vegetables |
N/A |
N/A |
7.14 |
9.26 |
3.07 |
0.00 |
12.35 |
141 |
|
|
Oils |
N/A |
N/A |
N/A |
N/A |
N/A |
0.00 |
0.00 |
N/A |
|
|
Per Caput Calories from Imports (Cal/Cap/Day) |
29 |
39 |
99 |
86 |
56 |
14 |
123 |
64 |
|
|
Aid + Commercial Food Import Bill (US$ 000) |
3,950 |
7,246 |
14,401 |
15,654 |
9,134 |
2,745 |
18,772 |
56 |
|
|
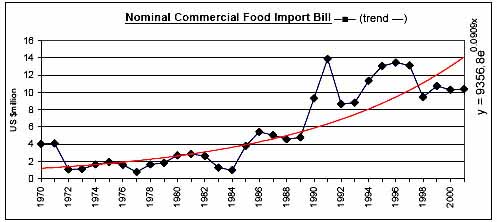
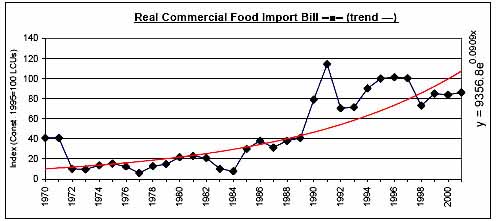
Commercial Food Import Bill (US$ 000) |
1,973 |
3,408 |
10,839 |
11,234 |
5,820 |
770 |
13,881 |
76 |
|
|
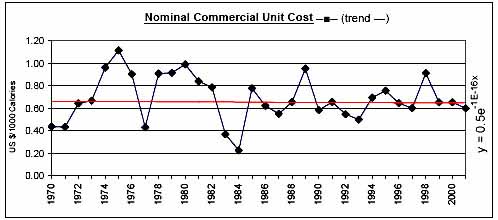
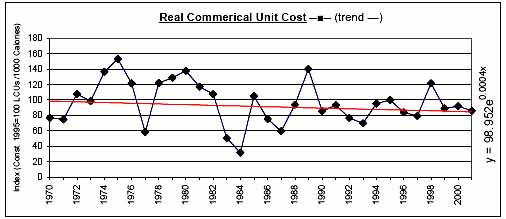
Commerical Unit Cost (US $/1000 calories) |
0.74 |
0.68 |
0.62 |
0.68 |
0.69 |
0.23 |
1.12 |
30 |
|
|
Commercial Food Import Bill / GDP (%) |
1.80 |
1.59 |
3.20 |
2.35 |
2.10 |
0.51 |
4.47 |
48 |
|
|
Comm. Fd. Imp. Bill / Total Merchandise Imp. Bill (%) |
N/A |
3.89 |
10.20 |
6.39 |
6.29 |
1.38 |
14.04 |
53 |
|
|
Comm. Fd. Imp. Bill / Total Merchandise Exp. Bill (%) |
N/A |
11.48 |
14.23 |
9.79 |
11.77 |
5.51 |
18.90 |
33 |
|
|
Commercial Food Value Bill Shares (%) |
Wheat |
14.93 |
16.86 |
21.64 |
25.48 |
18.77 |
0.00 |
74.66 |
102 |
|
Coarse Grains |
N/A |
N/A |
2.27 |
7.83 |
1.89 |
0.00 |
12.92 |
197 |
|
|
Rice |
33.55 |
44.44 |
42.92 |
23.66 |
36.85 |
0.00 |
70.61 |
54 |
|
|
Dairy |
15.64 |
5.03 |
8.80 |
15.31 |
10.98 |
0.00 |
32.47 |
72 |
|
|
Meat |
N/A |
N/A |
0.56 |
0.72 |
0.24 |
0.00 |
1.41 |
160 |
|
|
Sugar |
35.88 |
33.67 |
11.19 |
11.21 |
25.94 |
0.65 |
67.53 |
62 |
|
|
Fruits and Vegetables |
N/A |
N/A |
12.62 |
15.78 |
5.33 |
0.00 |
23.98 |
144 |
|
|
Oils |
N/A |
N/A |
N/A |
N/A |
N/A |
0.00 |
0.00 |
N/A |
|
|
|
|
|
|
|
|
|
|
![]()
![]()
![]()