![]()
![]()
![]()
|
Botswana |
Mean |
1970-2001 |
|||||||
|
1970-1979 |
1980-1989 |
1990-1995 |
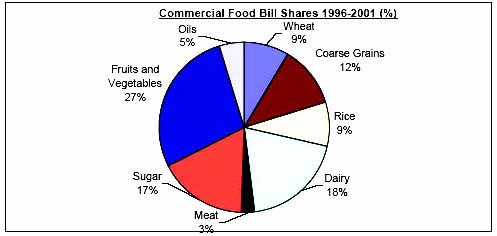
1996-2001 |
Mean |
Min. |
Max. |
Variation (%) |
||
|
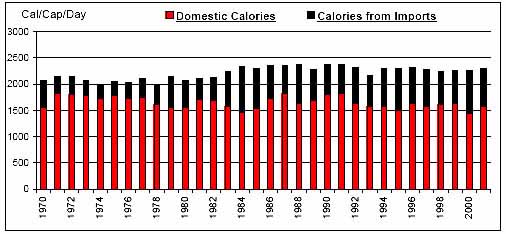
Per Caput Consumption (Cal/Day) |
2071 |
2257 |
2303 |
2271 |
2210 |
1970 |
2382 |
6 |
|
|
Imports / Consumption (%) |
Wheat |
96.66 |
97.30 |
98.26 |
98.70 |
97.54 |
95.11 |
99.33 |
1 |
|
Coarse Grains |
32.68 |
63.34 |
62.06 |
72.61 |
55.26 |
3.08 |
95.13 |
50 |
|
|
Rice |
100.00 |
100.00 |
100.00 |
100.00 |
100.00 |
100.00 |
100.00 |
0 |
|
|
Dairy |
9.84 |
27.55 |
43.45 |
52.54 |
29.68 |
1.81 |
60.38 |
61 |
|
|
Meat |
1.05 |
2.28 |
6.34 |
4.85 |
3.14 |
0.00 |
7.50 |
72 |
|
|
Sugar |
100.00 |
100.00 |
100.00 |
100.00 |
100.00 |
100.00 |
100.00 |
0 |
|
|
Fruits and Vegetables |
25.47 |
48.68 |
71.39 |
78.94 |
51.36 |
18.36 |
86.03 |
43 |
|
|
Oils |
22.29 |
67.05 |
74.49 |
68.17 |
54.67 |
5.07 |
86.47 |
46 |
|
|
Per Caput Calories from Imports (Cal/Cap/Day) |
359 |
617 |
658 |
694 |
559 |
238 |
887 |
32 |
|
|
Aid + Commercial Food Import Bill (US$ 000) |
17,746 |
73,038 |
168,472 |
223,986 |
101,956 |
8,315 |
230,157 |
80 |
|
|
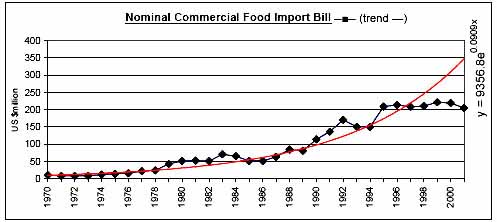
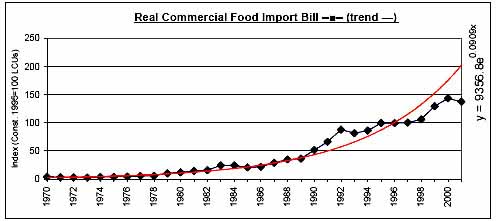
Commercial Food Import Bill (US$ 000) |
16,576 |
62,076 |
154,817 |
212,850 |
93,517 |
8,063 |
221,115 |
83 |
|
|
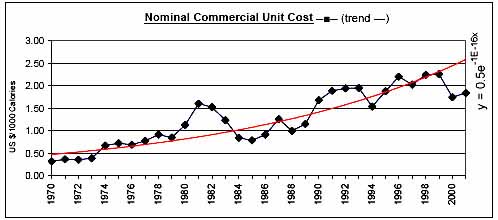
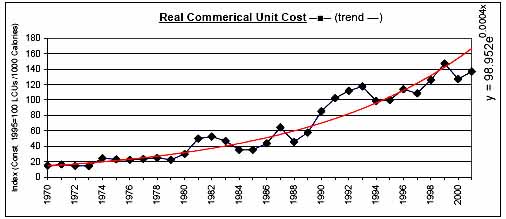
Commerical Unit Cost (US $/1000 calories) |
0.61 |
1.15 |
1.82 |
2.05 |
1.27 |
0.33 |
2.26 |
48 |
|
|
Commercial Food Import Bill / GDP (%) |
2.20 |
2.92 |
3.63 |
3.75 |
2.98 |
1.35 |
4.51 |
29 |
|
|
Comm. Fd. Imp. Bill / Total Merchandise Imp. Bill (%) |
8.41 |
7.53 |
8.42 |
10.03 |
8.44 |
5.02 |
18.31 |
29 |
|
|
Comm. Fd. Imp. Bill / Total Merchandise Exp. Bill (%) |
14.54 |
8.20 |
8.36 |
8.54 |
10.27 |
3.98 |
40.95 |
61 |
|
|
Commercial Food Value Bill Shares (%) |
Wheat |
15.74 |
12.65 |
8.23 |
8.53 |
12.01 |
5.03 |
20.42 |
35 |
|
Coarse Grains |
19.96 |
12.84 |
11.05 |
11.65 |
14.50 |
2.59 |
53.40 |
78 |
|
|
Rice |
1.47 |
4.77 |
6.88 |
8.55 |
4.84 |
0.00 |
9.33 |
60 |
|
|
Dairy |
12.21 |
19.03 |
21.67 |
19.22 |
17.43 |
2.38 |
24.06 |
33 |
|
|
Meat |
4.03 |
3.24 |
3.74 |
2.60 |
3.46 |
0.00 |
8.03 |
62 |
|
|
Sugar |
25.70 |
21.89 |
16.75 |
16.84 |
21.17 |
12.53 |
31.28 |
25 |
|
|
Fruits and Vegetables |
16.87 |
20.13 |
27.72 |
28.02 |
22.02 |
12.18 |
32.26 |
24 |
|
|
Oils |
4.02 |
5.45 |
3.96 |
4.59 |
4.56 |
0.00 |
11.07 |
45 |
|
|
|
|
|
|
|
|
|
|
![]()
![]()
![]()