![]()
![]()
![]()
|
Burkina Faso |
Mean |
1970-2001 |
|||||||
|
1970-1979 |
1980-1989 |
1990-1995 |
1996-2001 |
Mean |
Min. |
Max. |
Variation (%) |
||
|
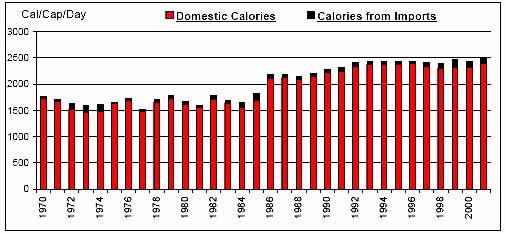
Per Caput Consumption (Cal/Day) |
1667 |
1893 |
2382 |
2440 |
2016 |
1511 |
2485 |
18 |
|
|
Imports / Consumption (%) |
Wheat |
100.00 |
100.00 |
100.00 |
100.00 |
100.00 |
100.00 |
100.00 |
0 |
|
Coarse Grains |
4.94 |
2.13 |
0.52 |
0.57 |
2.41 |
0.03 |
17.31 |
174 |
|
|
Rice |
15.72 |
57.15 |
57.88 |
53.24 |
43.61 |
0.11 |
73.55 |
52 |
|
|
Dairy |
18.66 |
37.86 |
17.77 |
13.47 |
23.52 |
4.02 |
50.87 |
62 |
|
|
Meat |
0.20 |
0.47 |
0.25 |
0.12 |
0.28 |
0.00 |
0.86 |
91 |
|
|
Sugar |
41.58 |
0.93 |
0.97 |
3.89 |
14.19 |
0.00 |
100.00 |
233 |
|
|
Fruits and Vegetables |
8.28 |
6.52 |
6.14 |
10.49 |
7.74 |
4.19 |
15.65 |
39 |
|
|
Oils |
2.35 |
4.35 |
3.57 |
5.67 |
3.83 |
0.72 |
10.46 |
59 |
|
|
Per Caput Calories from Imports (Cal/Cap/Day) |
64 |
76 |
62 |
96 |
74 |
23 |
145 |
44 |
|
|
Aid + Commercial Food Import Bill (US$ 000) |
29,843 |
63,098 |
75,860 |
101,487 |
62,296 |
7,276 |
157,229 |
51 |
|
|
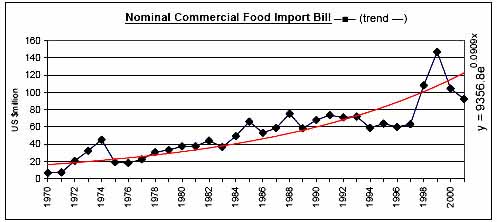
Commercial Food Import Bill (US$ 000) |
23,491 |
51,652 |
67,856 |
95,763 |
54,161 |
6,764 |
146,909 |
57 |
|
|
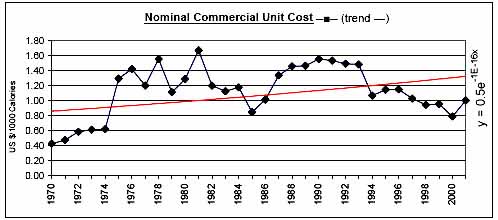
Commerical Unit Cost (US $/1000 calories) |
0.93 |
1.26 |
1.38 |
0.98 |
1.13 |
0.43 |
1.67 |
30 |
|
|
Commercial Food Import Bill / GDP (%) |
1.21 |
2.10 |
2.19 |
2.39 |
1.89 |
0.28 |
3.56 |
37 |
|
|
Comm. Fd. Imp. Bill / Total Merchandise Imp. Bill (%) |
18.76 |
13.92 |
12.17 |
14.89 |
15.29 |
7.99 |
34.15 |
44 |
|
|
Comm. Fd. Imp. Bill / Total Merchandise Exp. Bill (%) |
65.74 |
60.71 |
38.31 |
38.58 |
53.93 |
19.28 |
128.09 |
50 |
|
|
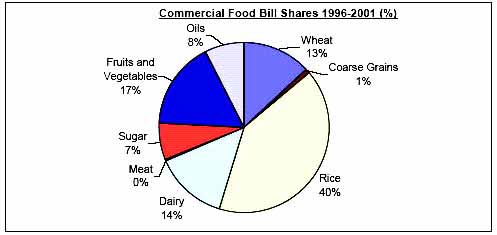
Commercial Food Value Bill Shares (%) |
Wheat |
15.72 |
10.20 |
9.90 |
13.15 |
12.42 |
2.72 |
26.24 |
44 |
|
Coarse Grains |
19.20 |
1.96 |
N/A |
0.72 |
6.75 |
0.00 |
68.64 |
281 |
|
|
Rice |
11.73 |
36.15 |
42.29 |
40.75 |
30.53 |
0.06 |
64.87 |
54 |
|
|
Dairy |
23.10 |
26.31 |
19.66 |
14.00 |
21.75 |
4.48 |
57.79 |
55 |
|
|
Meat |
0.83 |
1.15 |
0.48 |
0.22 |
0.75 |
0.00 |
2.63 |
103 |
|
|
Sugar |
11.45 |
2.32 |
2.20 |
7.06 |
6.04 |
0.00 |
27.41 |
126 |
|
|
Fruits and Vegetables |
14.21 |
14.70 |
21.28 |
16.59 |
16.13 |
6.17 |
31.55 |
42 |
|
|
Oils |
3.75 |
7.22 |
4.18 |
7.51 |
5.62 |
0.57 |
12.81 |
55 |
|
|
|
|
|
|
|
|
|
|
![]()
![]()
![]()