![]()
![]()
![]()
|
Burundi |
Mean |
1970-2001 |
|||||||
|
1970-1979 |
1980-1989 |
1990-1995 |
1996-2001 |
Mean |
Min. |
Max. |
Variation (%) |
||
|
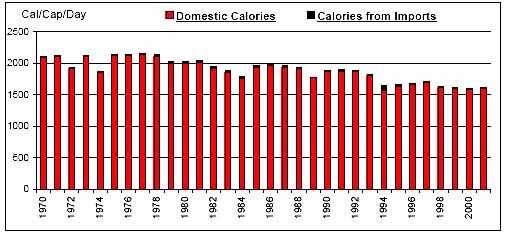
Per Caput Consumption (Cal/Day) |
2075 |
1929 |
1796 |
1639 |
1895 |
1604 |
2157 |
10 |
|
|
Imports / Consumption (%) |
Wheat |
65.65 |
64.08 |
69.89 |
54.07 |
63.78 |
36.49 |
82.90 |
17 |
|
Coarse Grains |
0.10 |
N/A |
6.08 |
1.78 |
1.51 |
0.00 |
30.62 |
365 |
|
|
Rice |
14.41 |
4.53 |
6.37 |
4.17 |
7.89 |
0.01 |
38.58 |
104 |
|
|
Dairy |
5.50 |
21.93 |
14.65 |
12.98 |
13.75 |
0.00 |
37.83 |
66 |
|
|
Meat |
1.60 |
1.33 |
0.60 |
0.08 |
1.04 |
0.00 |
3.52 |
76 |
|
|
Sugar |
37.75 |
53.22 |
4.01 |
1.24 |
29.41 |
0.54 |
74.83 |
88 |
|
|
Fruits and Vegetables |
0.09 |
0.06 |
0.64 |
0.17 |
0.20 |
0.00 |
2.00 |
225 |
|
|
Oils |
6.09 |
4.31 |
9.47 |
7.48 |
6.43 |
0.88 |
27.33 |
83 |
|
|
Per Caput Calories from Imports (Cal/Cap/Day) |
17 |
24 |
31 |
13 |
21 |
8 |
79 |
60 |
|
|
Aid + Commercial Food Import Bill (US$ 000) |
6,489 |
15,950 |
20,807 |
11,054 |
12,986 |
2,184 |
41,046 |
64 |
|
|
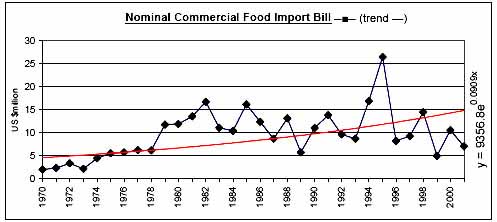
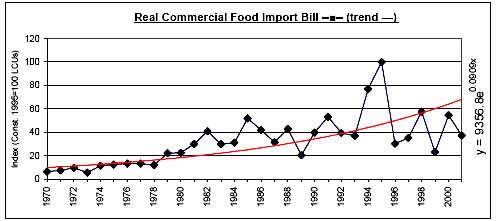
Commercial Food Import Bill (US$ 000) |
4,965 |
11,970 |
14,419 |
9,079 |
9,698 |
1,978 |
26,475 |
54 |
|
|
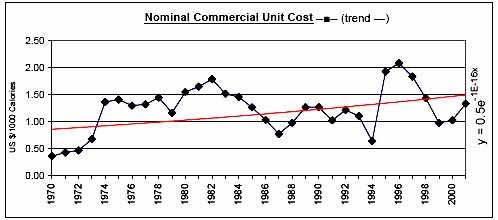
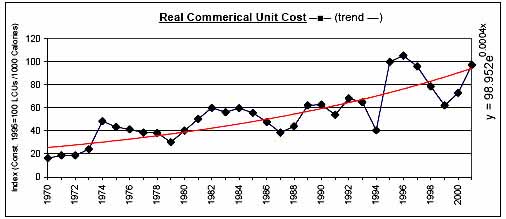
Commerical Unit Cost (US $/1000 calories) |
1.00 |
1.33 |
1.20 |
1.45 |
1.23 |
0.37 |
2.09 |
35 |
|
|
Commercial Food Import Bill / GDP (%) |
0.73 |
1.38 |
1.36 |
0.98 |
1.10 |
0.35 |
2.71 |
49 |
|
|
Comm. Fd. Imp. Bill / Total Merchandise Imp. Bill (%) |
8.43 |
6.30 |
6.29 |
6.61 |
7.02 |
3.03 |
11.33 |
29 |
|
|
Comm. Fd. Imp. Bill / Total Merchandise Exp. Bill (%) |
10.58 |
12.72 |
16.04 |
17.16 |
13.50 |
6.53 |
25.38 |
37 |
|
|
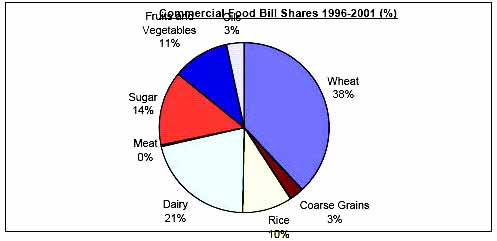
Commercial Food Value Bill Shares (%) |
Wheat |
29.80 |
27.86 |
41.19 |
38.00 |
32.86 |
6.48 |
55.67 |
37 |
|
Coarse Grains |
0.14 |
N/A |
5.63 |
2.74 |
1.61 |
0.00 |
33.79 |
380 |
|
|
Rice |
7.58 |
5.03 |
5.70 |
9.61 |
6.81 |
0.01 |
17.76 |
77 |
|
|
Dairy |
11.51 |
20.51 |
18.04 |
20.92 |
17.31 |
0.00 |
31.39 |
50 |
|
|
Meat |
11.31 |
5.56 |
1.77 |
0.42 |
5.68 |
0.00 |
17.49 |
87 |
|
|
Sugar |
24.05 |
37.36 |
15.52 |
14.10 |
24.74 |
2.43 |
51.74 |
50 |
|
|
Fruits and Vegetables |
7.97 |
1.59 |
8.98 |
10.83 |
6.70 |
0.00 |
42.77 |
140 |
|
|
Oils |
7.65 |
2.09 |
3.16 |
3.38 |
4.27 |
0.00 |
15.10 |
88 |
|
|
|
|
|
|
|
|
|
|
![]()
![]()
![]()