![]()
![]()
![]()
|
Cambodia |
Mean |
1970-2001 |
|||||||
|
1970-1979 |
1980-1989 |
1990-1995 |
1996-2001 |
Mean |
Min. |
Max. |
Variation (%) |
||
|
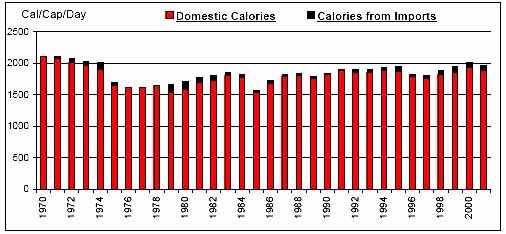
Per Caput Consumption (Cal/Day) |
1858 |
1768 |
1899 |
1905 |
1847 |
1558 |
2113 |
8 |
|
|
Imports / Consumption (%) |
Wheat |
100.00 |
100.00 |
100.00 |
100.00 |
100.00 |
100.00 |
100.00 |
0 |
|
Coarse Grains |
0.47 |
N/A |
N/A |
1.69 |
0.46 |
0.00 |
8.63 |
347 |
|
|
Rice |
7.07 |
4.96 |
2.22 |
1.08 |
4.38 |
0.00 |
27.10 |
141 |
|
|
Dairy |
32.42 |
12.92 |
30.82 |
48.96 |
29.13 |
0.00 |
77.41 |
84 |
|
|
Meat |
0.10 |
N/A |
0.00 |
0.07 |
0.05 |
0.00 |
0.43 |
218 |
|
|
Sugar |
3.26 |
4.29 |
7.85 |
34.54 |
10.31 |
0.89 |
50.88 |
132 |
|
|
Fruits and Vegetables |
0.27 |
0.01 |
0.05 |
1.26 |
0.33 |
0.00 |
1.71 |
155 |
|
|
Oils |
1.14 |
1.77 |
12.03 |
15.11 |
6.00 |
0.00 |
34.84 |
138 |
|
|
Per Caput Calories from Imports (Cal/Cap/Day) |
49 |
55 |
41 |
64 |
52 |
1 |
120 |
64 |
|
|
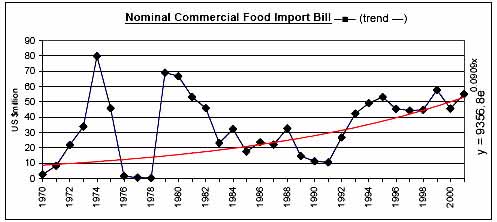
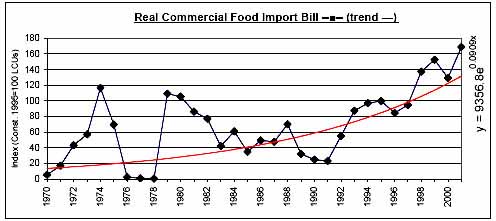
Aid + Commercial Food Import Bill (US$ 000) |
27,865 |
34,544 |
41,053 |
61,844 |
38,796 |
380 |
94,921 |
67 |
|
|
Commercial Food Import Bill (US$ 000) |
26,465 |
33,241 |
32,277 |
48,895 |
33,878 |
380 |
79,844 |
64 |
|
|
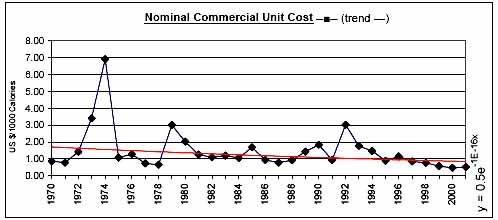
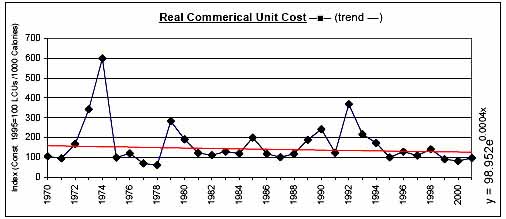
Commerical Unit Cost (US $/1000 calories) |
2.02 |
1.25 |
1.66 |
0.73 |
1.47 |
0.49 |
6.91 |
83 |
|
|
Commercial Food Import Bill / GDP (%) |
2.59 |
4.62 |
3.32 |
4.01 |
3.63 |
0.04 |
8.94 |
65 |
|
|
Comm. Fd. Imp. Bill / Total Merchandise Imp. Bill (%) |
22.89 |
17.47 |
7.95 |
7.52 |
15.51 |
1.90 |
54.64 |
86 |
|
|
Comm. Fd. Imp. Bill / Total Merchandise Exp. Bill (%) |
178.31 |
196.16 |
13.43 |
13.93 |
122.15 |
1.65 |
612.00 |
144 |
|
|
Commercial Food Value Bill Shares (%) |
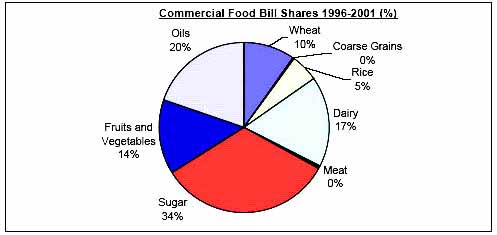
Wheat |
4.29 |
3.41 |
1.64 |
9.68 |
4.53 |
0.00 |
19.26 |
128 |
|
Coarse Grains |
0.06 |
N/A |
N/A |
0.36 |
0.09 |
0.00 |
1.56 |
344 |
|
|
Rice |
40.27 |
88.18 |
50.61 |
5.27 |
50.62 |
0.00 |
95.97 |
76 |
|
|
Dairy |
11.88 |
1.47 |
12.86 |
17.19 |
9.80 |
0.00 |
39.21 |
111 |
|
|
Meat |
0.24 |
N/A |
0.02 |
0.50 |
0.17 |
0.00 |
2.02 |
244 |
|
|
Sugar |
35.54 |
6.90 |
18.27 |
33.17 |
22.91 |
1.88 |
100.00 |
109 |
|
|
Fruits and Vegetables |
5.12 |
0.03 |
0.90 |
14.06 |
4.41 |
0.00 |
27.82 |
165 |
|
|
Oils |
2.60 |
N/A |
15.70 |
19.78 |
7.47 |
0.00 |
42.03 |
142 |
|
|
|
|
|
|
|
|
|
|
![]()
![]()
![]()