![]()
![]()
![]()
|
Cape Verde |
Mean |
1970-2001 |
|||||||
|
1970-1979 |
1980-1989 |
1990-1995 |
1996-2001 |
Mean |
Min. |
Max. |
Variation (%) |
||
|
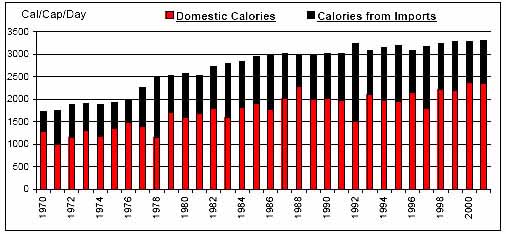
Per Caput Consumption (Cal/Day) |
2027 |
2836 |
3110 |
3227 |
2708 |
1712 |
3308 |
19 |
|
|
Imports / Consumption (%) |
Wheat |
100.00 |
100.00 |
100.00 |
100.00 |
100.00 |
100.00 |
100.00 |
0 |
|
Coarse Grains |
93.26 |
82.95 |
81.06 |
60.60 |
81.62 |
38.72 |
98.51 |
20 |
|
|
Rice |
100.00 |
100.00 |
100.00 |
100.00 |
100.00 |
100.00 |
100.00 |
0 |
|
|
Dairy |
71.51 |
78.20 |
74.33 |
69.73 |
73.80 |
52.31 |
92.36 |
12 |
|
|
Meat |
10.29 |
8.64 |
13.61 |
19.41 |
12.11 |
3.30 |
29.96 |
52 |
|
|
Sugar |
34.20 |
46.93 |
43.80 |
57.29 |
44.31 |
3.68 |
62.20 |
29 |
|
|
Fruits and Vegetables |
32.26 |
27.60 |
35.35 |
37.05 |
32.28 |
15.88 |
45.58 |
28 |
|
|
Oils |
9.34 |
23.35 |
52.48 |
61.42 |
31.57 |
3.78 |
67.29 |
71 |
|
|
Per Caput Calories from Imports (Cal/Cap/Day) |
730 |
992 |
1189 |
1055 |
959 |
423 |
1743 |
28 |
|
|
Aid + Commercial Food Import Bill (US$ 000) |
11,988 |
21,259 |
44,384 |
54,052 |
28,846 |
4,976 |
60,152 |
62 |
|
|
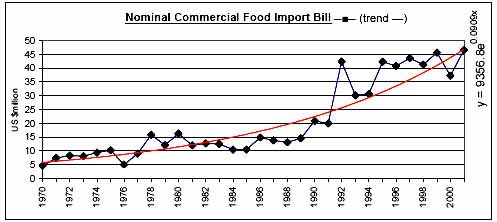
Commercial Food Import Bill (US$ 000) |
9,069 |
13,133 |
31,063 |
42,547 |
20,740 |
4,611 |
46,576 |
68 |
|
|
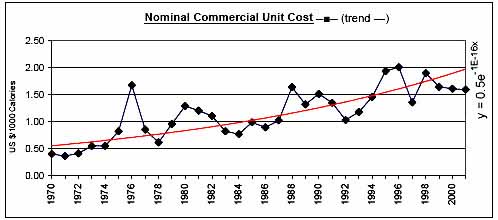
Commerical Unit Cost (US $/1000 calories) |
0.72 |
1.11 |
1.41 |
1.69 |
1.16 |
0.37 |
2.01 |
40 |
|
|
Commercial Food Import Bill / GDP (%) |
3.91 |
4.94 |
9.84 |
9.76 |
6.44 |
2.01 |
15.26 |
49 |
|
|
Comm. Fd. Imp. Bill / Total Merchandise Imp. Bill (%) |
27.85 |
14.76 |
17.23 |
17.40 |
19.81 |
11.00 |
36.80 |
36 |
|
|
Comm. Fd. Imp. Bill / Total Merchandise Exp. Bill (%) |
472.87 |
319.04 |
572.30 |
373.32 |
424.77 |
178.75 |
928.50 |
40 |
|
|
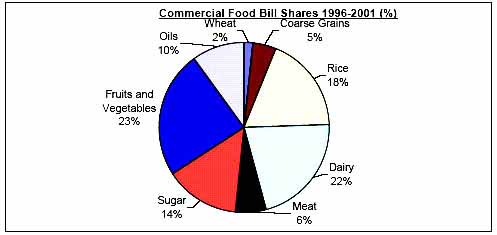
Commercial Food Value Bill Shares (%) |
Wheat |
3.32 |
0.76 |
3.51 |
1.66 |
2.24 |
0.00 |
9.91 |
126 |
|
Coarse Grains |
28.55 |
11.16 |
6.46 |
4.56 |
14.48 |
0.00 |
41.38 |
91 |
|
|
Rice |
13.65 |
22.31 |
15.52 |
18.16 |
17.55 |
8.15 |
34.16 |
38 |
|
|
Dairy |
10.53 |
15.89 |
20.82 |
21.59 |
16.21 |
5.81 |
28.11 |
39 |
|
|
Meat |
2.40 |
2.90 |
3.77 |
5.84 |
3.45 |
0.00 |
9.70 |
70 |
|
|
Sugar |
15.20 |
22.76 |
15.60 |
14.16 |
17.44 |
2.51 |
33.32 |
40 |
|
|
Fruits and Vegetables |
20.62 |
15.82 |
24.17 |
24.02 |
20.42 |
8.01 |
29.73 |
28 |
|
|
Oils |
5.72 |
8.42 |
10.16 |
10.02 |
8.20 |
2.05 |
15.12 |
40 |
|
|
|
|
|
|
|
|
|
|
![]()
![]()
![]()