![]()
![]()
![]()
|
Eq Guinea |
Mean |
1970-2001 |
|||||||
|
1970-1979 |
1980-1989 |
1990-1995 |
1996-2001 |
Mean |
Min. |
Max. |
Variation (%) |
||
|
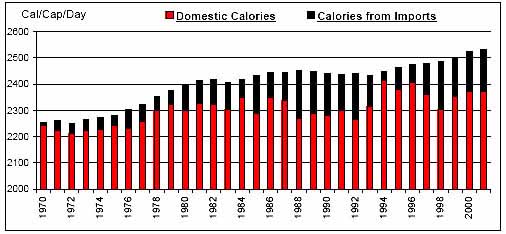
Per Caput Consumption (Cal/Day) |
2293 |
2427 |
2444 |
2500 |
2402 |
2249 |
2533 |
3 |
|
|
Imports / Consumption (%) |
Wheat |
N/A |
100.00 |
100.00 |
100.00 |
100.00 |
100.00 |
100.00 |
0 |
|
Coarse Grains |
N/A |
N/A |
N/A |
N/A |
N/A |
0.00 |
0.00 |
N/A |
|
|
Rice |
100.00 |
100.00 |
100.00 |
100.00 |
100.00 |
100.00 |
100.00 |
0 |
|
|
Dairy |
100.00 |
100.00 |
100.00 |
100.00 |
100.00 |
100.00 |
100.00 |
0 |
|
|
Meat |
3.77 |
70.48 |
80.19 |
88.49 |
54.83 |
0.00 |
89.78 |
67 |
|
|
Sugar |
100.00 |
100.00 |
100.00 |
100.00 |
100.00 |
100.00 |
100.00 |
0 |
|
|
Fruits and Vegetables |
N/A |
1.54 |
0.06 |
N/A |
0.49 |
0.00 |
10.57 |
393 |
|
|
Oils |
N/A |
N/A |
N/A |
N/A |
N/A |
0.00 |
0.00 |
N/A |
|
|
Per Caput Calories from Imports (Cal/Cap/Day) |
46 |
113 |
118 |
139 |
98 |
11 |
183 |
51 |
|
|
Aid + Commercial Food Import Bill (US$ 000) |
1,097 |
5,753 |
8,981 |
9,713 |
5,646 |
170 |
13,572 |
70 |
|
|
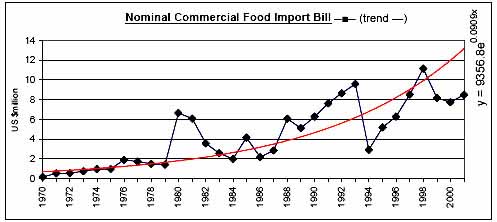
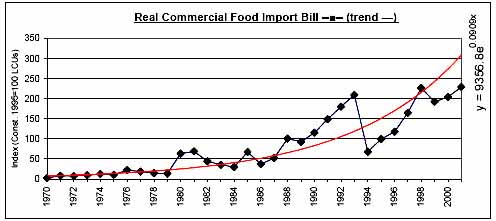
Commercial Food Import Bill (US$ 000) |
1,053 |
4,133 |
6,719 |
8,406 |
4,457 |
170 |
11,162 |
71 |
|
|
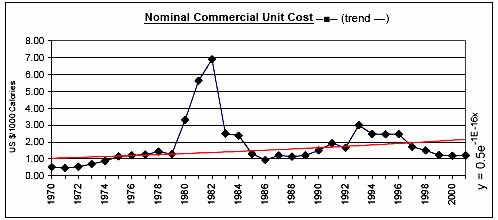
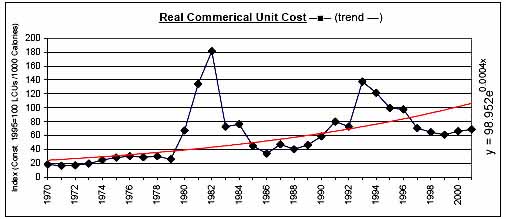
Commerical Unit Cost (US $/1000 calories) |
0.95 |
2.66 |
2.18 |
1.56 |
1.83 |
0.48 |
6.90 |
75 |
|
|
Commercial Food Import Bill / GDP (%) |
1.37 |
4.60 |
6.05 |
2.17 |
3.41 |
0.27 |
8.31 |
72 |
|
|
Comm. Fd. Imp. Bill / Total Merchandise Imp. Bill (%) |
11.54 |
10.18 |
10.93 |
22.79 |
13.16 |
1.63 |
44.42 |
81 |
|
|
Comm. Fd. Imp. Bill / Total Merchandise Exp. Bill (%) |
6.03 |
14.98 |
9.89 |
2.18 |
8.92 |
1.53 |
44.31 |
98 |
|
|
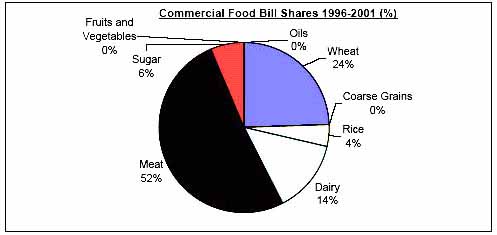
Commercial Food Value Bill Shares (%) |
Wheat |
N/A |
13.14 |
9.61 |
24.33 |
10.47 |
0.00 |
32.06 |
105 |
|
Coarse Grains |
N/A |
N/A |
N/A |
N/A |
N/A |
0.00 |
0.00 |
N/A |
|
|
Rice |
53.08 |
20.64 |
13.99 |
4.33 |
26.47 |
0.00 |
73.68 |
100 |
|
|
Dairy |
0.49 |
11.40 |
31.30 |
13.92 |
12.20 |
0.00 |
50.09 |
103 |
|
|
Meat |
2.01 |
45.60 |
41.41 |
51.03 |
32.21 |
0.00 |
78.23 |
80 |
|
|
Sugar |
44.41 |
5.92 |
2.82 |
6.40 |
17.46 |
0.00 |
100.00 |
125 |
|
|
Fruits and Vegetables |
N/A |
3.29 |
0.86 |
N/A |
1.19 |
0.00 |
18.60 |
331 |
|
|
Oils |
N/A |
N/A |
N/A |
N/A |
N/A |
0.00 |
0.00 |
N/A |
|
|
|
|
|
|
|
|
|
|
![]()
![]()
![]()