![]()
![]()
![]()
|
Egypt |
Mean |
1970-2001 |
|||||||
|
1970-1979 |
1980-1989 |
1990-1995 |
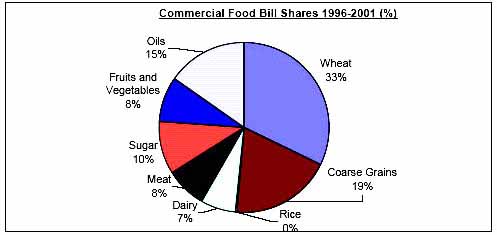
1996-2001 |
Mean |
Min. |
Max. |
Variation (%) |
||
|
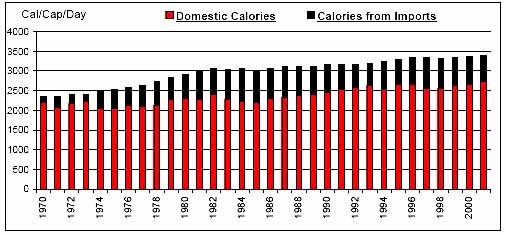
Per Caput Consumption (Cal/Day) |
2533 |
3050 |
3205 |
3349 |
2974 |
2350 |
3385 |
11 |
|
|
Imports / Consumption (%) |
Wheat |
61.58 |
74.84 |
55.81 |
49.06 |
62.29 |
41.52 |
79.49 |
19 |
|
Coarse Grains |
8.03 |
25.45 |
24.54 |
33.78 |
21.40 |
1.16 |
40.68 |
51 |
|
|
Rice |
0.00 |
0.24 |
0.04 |
0.03 |
0.09 |
0.00 |
1.03 |
276 |
|
|
Dairy |
8.58 |
25.23 |
19.19 |
14.24 |
16.83 |
1.30 |
32.82 |
50 |
|
|
Meat |
7.00 |
24.30 |
13.67 |
10.26 |
14.27 |
2.29 |
31.59 |
56 |
|
|
Sugar |
1.65 |
6.70 |
4.02 |
4.99 |
4.30 |
0.00 |
8.54 |
60 |
|
|
Fruits and Vegetables |
1.14 |
1.51 |
1.70 |
1.99 |
1.52 |
0.34 |
2.75 |
43 |
|
|
Oils |
18.58 |
32.54 |
46.13 |
49.39 |
33.89 |
8.28 |
53.50 |
40 |
|
|
Per Caput Calories from Imports (Cal/Cap/Day) |
394 |
739 |
644 |
722 |
610 |
170 |
820 |
30 |
|
|
Aid + Commercial Food Import Bill (US$ 000) |
857,021 |
2,695,511 |
2,163,067 |
2,666,407 |
2,015,693 |
136,091 |
3,328,523 |
46 |
|
|
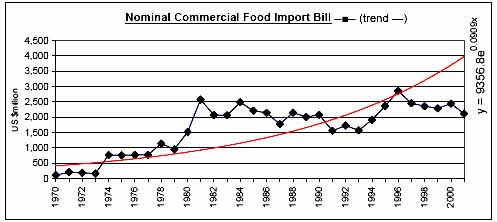
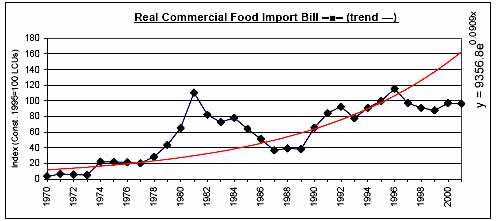
Commercial Food Import Bill (US$ 000) |
586,816 |
2,102,431 |
1,872,930 |
2,422,488 |
1,645,780 |
112,621 |
2,854,555 |
49 |
|
|
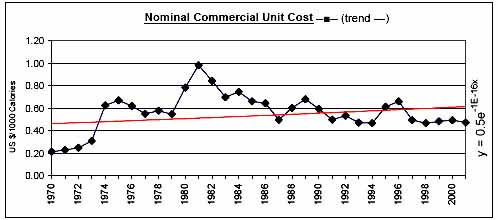
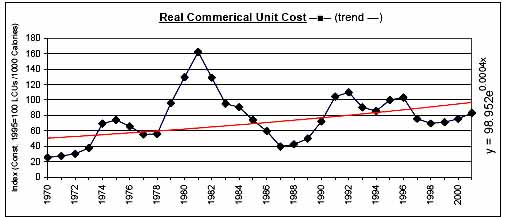
Commerical Unit Cost (US $/1000 calories) |
0.46 |
0.72 |
0.53 |
0.51 |
0.56 |
0.22 |
0.98 |
30 |
|
|
Commercial Food Import Bill / GDP (%) |
1.34 |
2.99 |
1.94 |
1.96 |
2.08 |
0.35 |
4.58 |
43 |
|
|
Comm. Fd. Imp. Bill / Total Merchandise Imp. Bill (%) |
20.77 |
24.87 |
20.27 |
15.64 |
20.99 |
13.47 |
32.95 |
23 |
|
|
Comm. Fd. Imp. Bill / Total Merchandise Exp. Bill (%) |
39.90 |
73.69 |
55.64 |
46.96 |
54.73 |
14.79 |
101.54 |
37 |
|
|
Commercial Food Value Bill Shares (%) |
Wheat |
52.33 |
40.75 |
38.85 |
32.30 |
42.43 |
24.16 |
67.41 |
23 |
|
Coarse Grains |
5.91 |
10.89 |
12.57 |
19.19 |
11.21 |
1.22 |
26.12 |
50 |
|
|
Rice |
0.00 |
0.02 |
0.01 |
0.04 |
0.02 |
0.00 |
0.16 |
211 |
|
|
Dairy |
4.96 |
9.10 |
8.38 |
6.71 |
7.23 |
1.43 |
10.89 |
37 |
|
|
Meat |
5.51 |
12.58 |
7.78 |
7.81 |
8.57 |
1.29 |
16.55 |
40 |
|
|
Sugar |
5.55 |
10.30 |
9.81 |
10.13 |
8.69 |
0.00 |
16.50 |
52 |
|
|
Fruits and Vegetables |
5.02 |
4.63 |
6.51 |
8.41 |
5.81 |
2.10 |
10.86 |
41 |
|
|
Oils |
20.72 |
11.73 |
16.07 |
15.41 |
16.04 |
8.81 |
32.05 |
32 |
|
|
|
|
|
|
|
|
|
|
![]()
![]()
![]()