![]()
![]()
![]()
|
Dominican Rep. |
Mean |
1970-2001 |
|||||||
|
1970-1979 |
1980-1989 |
1990-1995 |
1996-2001 |
Mean |
Min. |
Max. |
Variation (%) |
||
|
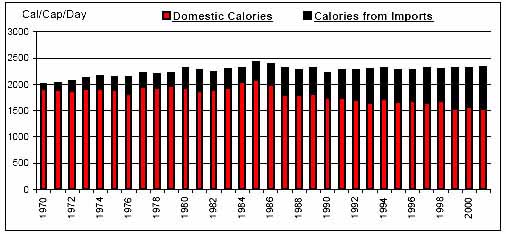
Per Caput Consumption (Cal/Day) |
2134 |
2317 |
2275 |
2308 |
2250 |
2006 |
2423 |
4 |
|
|
Imports / Consumption (%) |
Wheat |
100.00 |
100.00 |
100.00 |
100.00 |
100.00 |
100.00 |
100.00 |
0 |
|
Coarse Grains |
41.11 |
71.25 |
90.49 |
94.31 |
69.76 |
7.47 |
97.12 |
36 |
|
|
Rice |
9.19 |
5.56 |
4.14 |
8.80 |
7.04 |
0.00 |
21.32 |
91 |
|
|
Dairy |
9.54 |
20.28 |
31.96 |
27.29 |
20.43 |
3.04 |
37.90 |
55 |
|
|
Meat |
1.02 |
3.39 |
0.62 |
3.21 |
2.10 |
0.10 |
10.92 |
126 |
|
|
Sugar |
0.00 |
0.00 |
0.38 |
0.80 |
0.22 |
0.00 |
1.66 |
179 |
|
|
Fruits and Vegetables |
1.01 |
0.73 |
1.39 |
2.25 |
1.22 |
0.26 |
2.94 |
53 |
|
|
Oils |
22.98 |
40.20 |
34.14 |
37.71 |
33.21 |
9.44 |
45.39 |
28 |
|
|
Per Caput Calories from Imports (Cal/Cap/Day) |
224 |
402 |
569 |
697 |
433 |
90 |
797 |
44 |
|
|
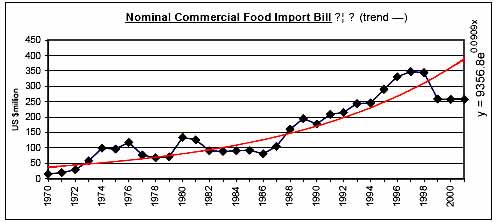
Aid + Commercial Food Import Bill (US$ 000) |
81,085 |
157,884 |
266,827 |
348,351 |
190,024 |
22,053 |
403,798 |
57 |
|
|
Commercial Food Import Bill (US$ 000) |
65,026 |
116,348 |
230,411 |
300,031 |
156,137 |
15,101 |
347,938 |
63 |
|
|
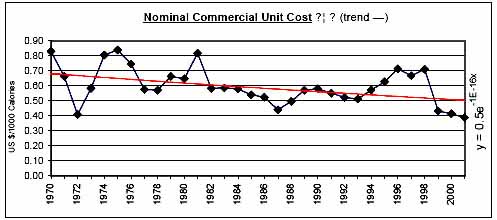
Commerical Unit Cost (US $/1000 calories) |
0.67 |
0.58 |
0.56 |
0.55 |
0.60 |
0.39 |
0.84 |
21 |
|
|
Commercial Food Import Bill / GDP (%) |
1.71 |
2.06 |
3.35 |
3.14 |
2.39 |
0.61 |
4.08 |
39 |
|
|
Comm. Fd. Imp. Bill / Total Merchandise Imp. Bill (%) |
10.23 |
7.87 |
9.82 |
6.33 |
8.68 |
4.02 |
15.40 |
33 |
|
|
Comm. Fd. Imp. Bill / Total Merchandise Exp. Bill (%) |
10.71 |
13.43 |
33.57 |
33.31 |
20.08 |
7.06 |
40.48 |
56 |
|
|
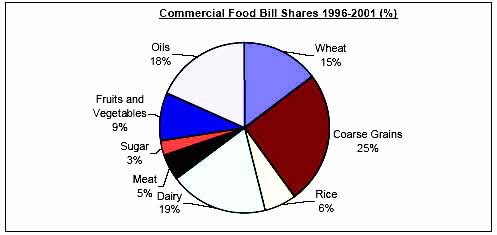
Commercial Food Value Bill Shares (%) |
Wheat |
24.99 |
20.17 |
17.85 |
14.73 |
20.22 |
0.00 |
43.21 |
43 |
|
Coarse Grains |
5.80 |
18.74 |
27.72 |
25.21 |
17.59 |
0.00 |
35.50 |
61 |
|
|
Rice |
14.83 |
4.40 |
1.29 |
6.10 |
7.40 |
0.00 |
40.79 |
136 |
|
|
Dairy |
12.48 |
14.03 |
23.36 |
18.81 |
16.19 |
1.40 |
38.83 |
56 |
|
|
Meat |
2.13 |
5.22 |
0.95 |
4.81 |
3.38 |
0.28 |
14.06 |
111 |
|
|
Sugar |
0.00 |
0.00 |
3.11 |
2.73 |
1.10 |
0.00 |
5.68 |
159 |
|
|
Fruits and Vegetables |
13.55 |
7.15 |
7.01 |
9.39 |
9.54 |
3.96 |
25.98 |
55 |
|
|
Oils |
26.21 |
30.29 |
18.71 |
18.22 |
24.58 |
12.94 |
44.11 |
30 |
|
|
|
|
|
|
|
|
|
|
![]()
![]()
![]()