![]()
![]()
![]()
|
Dominica |
Mean |
1970-2001 |
|||||||
|
1970-1979 |
1980-1989 |
1990-1995 |
1996-2001 |
Mean |
Min. |
Max. |
Variation (%) |
||
|
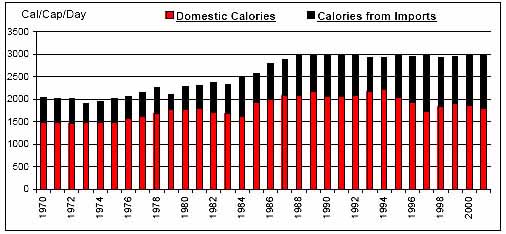
Per Caput Consumption (Cal/Day) |
2048 |
2596 |
2969 |
2968 |
2565 |
1911 |
2996 |
16 |
|
|
Imports / Consumption (%) |
Wheat |
100.00 |
100.00 |
100.00 |
100.00 |
100.00 |
100.00 |
100.00 |
0 |
|
Coarse Grains |
8.33 |
11.43 |
12.95 |
10.60 |
10.59 |
0.00 |
33.05 |
86 |
|
|
Rice |
100.00 |
100.00 |
100.00 |
100.00 |
100.00 |
100.00 |
100.00 |
0 |
|
|
Dairy |
67.17 |
51.10 |
48.64 |
54.55 |
56.31 |
44.80 |
77.66 |
18 |
|
|
Meat |
63.39 |
68.40 |
73.22 |
72.36 |
68.48 |
55.16 |
78.01 |
9 |
|
|
Sugar |
38.14 |
36.45 |
42.48 |
43.22 |
39.38 |
13.86 |
60.84 |
24 |
|
|
Fruits and Vegetables |
1.05 |
1.06 |
1.88 |
2.67 |
1.51 |
0.57 |
3.58 |
49 |
|
|
Oils |
1.46 |
4.95 |
5.58 |
17.62 |
6.35 |
1.13 |
21.91 |
98 |
|
|
Per Caput Calories from Imports (Cal/Cap/Day) |
501 |
714 |
866 |
1127 |
753 |
336 |
1270 |
33 |
|
|
Aid + Commercial Food Import Bill (US$ 000) |
4,423 |
11,279 |
19,163 |
22,882 |
12,790 |
2,869 |
32,508 |
60 |
|
|
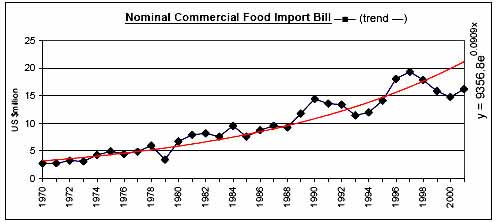
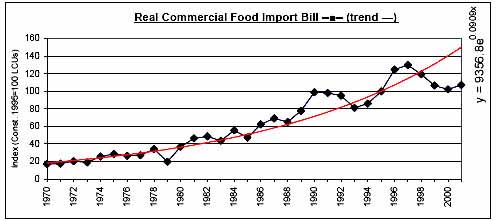
Commercial Food Import Bill (US$ 000) |
4,005 |
8,714 |
13,169 |
17,028 |
9,636 |
2,740 |
19,376 |
52 |
|
|
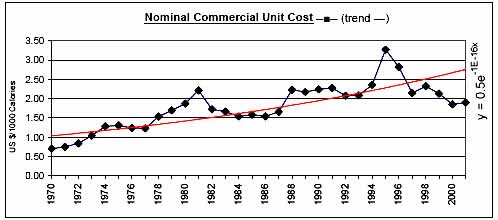
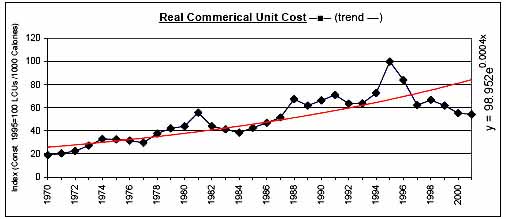
Commerical Unit Cost (US $/1000 calories) |
1.16 |
1.82 |
2.39 |
2.20 |
1.79 |
0.70 |
3.27 |
32 |
|
|
Commercial Food Import Bill / GDP (%) |
4.55 |
5.63 |
6.24 |
7.15 |
5.69 |
3.78 |
8.30 |
20 |
|
|
Comm. Fd. Imp. Bill / Total Merchandise Imp. Bill (%) |
20.36 |
14.65 |
12.36 |
13.52 |
15.79 |
10.61 |
24.51 |
25 |
|
|
Comm. Fd. Imp. Bill / Total Merchandise Exp. Bill (%) |
42.87 |
31.92 |
26.13 |
32.19 |
34.31 |
16.71 |
69.30 |
32 |
|
|
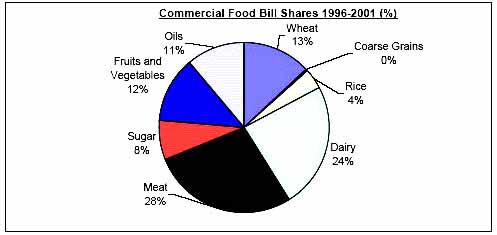
Commercial Food Value Bill Shares (%) |
Wheat |
21.64 |
19.92 |
13.46 |
13.10 |
17.97 |
0.00 |
27.35 |
38 |
|
Coarse Grains |
0.11 |
0.11 |
0.10 |
0.12 |
0.11 |
0.00 |
0.35 |
75 |
|
|
Rice |
3.80 |
3.27 |
2.22 |
4.10 |
3.39 |
0.00 |
7.01 |
50 |
|
|
Dairy |
19.41 |
20.35 |
21.21 |
23.78 |
20.86 |
14.98 |
26.50 |
14 |
|
|
Meat |
25.88 |
29.98 |
33.51 |
27.78 |
28.95 |
15.71 |
37.60 |
19 |
|
|
Sugar |
17.67 |
12.43 |
10.63 |
7.58 |
12.82 |
3.49 |
24.63 |
44 |
|
|
Fruits and Vegetables |
7.79 |
7.35 |
13.43 |
12.33 |
9.56 |
3.09 |
16.07 |
33 |
|
|
Oils |
3.71 |
6.61 |
5.44 |
11.22 |
6.35 |
1.31 |
15.01 |
53 |
|
|
|
|
|
|
|
|
|
|
![]()
![]()
![]()