![]()
![]()
![]()
|
Djibouti |
Mean |
1970-2001 |
|||||||
|
1970-1979 |
1980-1989 |
1990-1995 |
1996-2001 |
Mean |
Min. |
Max. |
Variation (%) |
||
|
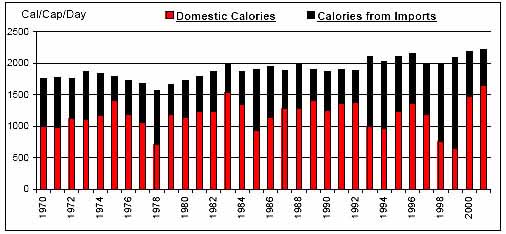
Per Caput Consumption (Cal/Day) |
1741 |
1884 |
1982 |
2101 |
1898 |
1570 |
2218 |
8 |
|
|
Imports / Consumption (%) |
Wheat |
100.00 |
100.00 |
100.00 |
100.00 |
100.00 |
100.00 |
100.00 |
0 |
|
Coarse Grains |
100.00 |
99.86 |
99.58 |
99.50 |
99.78 |
99.14 |
100.00 |
0 |
|
|
Rice |
100.00 |
100.00 |
100.00 |
100.00 |
100.00 |
100.00 |
100.00 |
0 |
|
|
Dairy |
57.48 |
70.06 |
62.04 |
65.82 |
63.83 |
39.16 |
82.76 |
16 |
|
|
Meat |
7.37 |
14.42 |
9.86 |
9.14 |
10.37 |
0.00 |
23.96 |
53 |
|
|
Sugar |
100.00 |
99.83 |
99.74 |
99.56 |
99.82 |
99.07 |
100.00 |
0 |
|
|
Fruits and Vegetables |
77.75 |
42.28 |
29.24 |
16.48 |
46.08 |
14.75 |
84.94 |
53 |
|
|
Oils |
100.00 |
100.00 |
100.00 |
100.00 |
100.00 |
100.00 |
100.00 |
0 |
|
|
Per Caput Calories from Imports (Cal/Cap/Day) |
650 |
633 |
787 |
923 |
721 |
388 |
1441 |
33 |
|
|
Aid + Commercial Food Import Bill (US$ 000) |
13,404 |
35,182 |
47,173 |
55,101 |
34,359 |
4,634 |
67,232 |
53 |
|
|
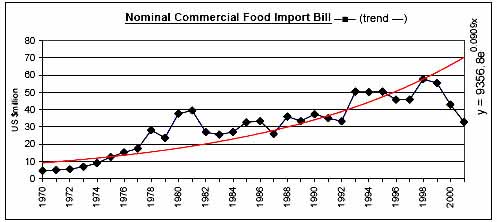
Commercial Food Import Bill (US$ 000) |
12,801 |
31,783 |
42,787 |
46,768 |
30,724 |
4,556 |
57,665 |
50 |
|
|
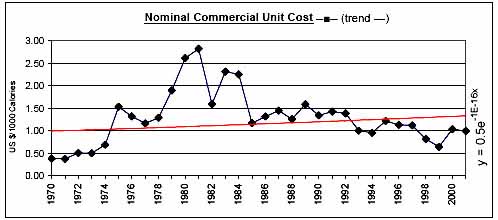
Commerical Unit Cost (US $/1000 calories) |
0.97 |
1.84 |
1.23 |
0.96 |
1.29 |
0.38 |
2.82 |
46 |
|
|
Commercial Food Import Bill / GDP (%) |
3.11 |
6.69 |
9.37 |
11.30 |
6.94 |
1.42 |
14.17 |
51 |
|
|
Comm. Fd. Imp. Bill / Total Merchandise Imp. Bill (%) |
12.40 |
15.45 |
21.16 |
29.25 |
18.15 |
6.87 |
36.44 |
42 |
|
|
Comm. Fd. Imp. Bill / Total Merchandise Exp. Bill (%) |
89.47 |
235.76 |
268.71 |
330.61 |
214.01 |
32.83 |
473.99 |
65 |
|
|
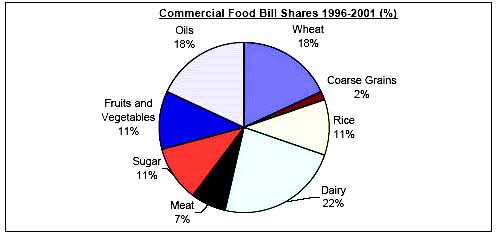
Commercial Food Value Bill Shares (%) |
Wheat |
13.89 |
5.10 |
12.89 |
17.97 |
11.72 |
1.66 |
34.38 |
60 |
|
Coarse Grains |
1.55 |
2.59 |
1.55 |
1.64 |
1.89 |
0.00 |
5.93 |
72 |
|
|
Rice |
18.71 |
20.81 |
21.30 |
10.64 |
18.34 |
7.46 |
29.56 |
31 |
|
|
Dairy |
15.56 |
22.33 |
17.95 |
23.37 |
19.59 |
6.62 |
37.94 |
36 |
|
|
Meat |
6.59 |
9.48 |
8.70 |
6.69 |
7.91 |
0.00 |
17.14 |
58 |
|
|
Sugar |
21.26 |
12.12 |
14.10 |
10.61 |
15.06 |
3.03 |
46.20 |
54 |
|
|
Fruits and Vegetables |
17.76 |
22.87 |
17.16 |
11.01 |
17.98 |
7.67 |
28.42 |
34 |
|
|
Oils |
4.68 |
4.71 |
6.35 |
18.06 |
7.51 |
2.01 |
22.31 |
74 |
|
|
|
|
|
|
|
|
|
|
![]()
![]()
![]()