![]()
![]()
![]()
|
Cuba |
Mean |
1970-2001 |
|||||||
|
1970-1979 |
1980-1989 |
1990-1995 |
1996-2001 |
Mean |
Min. |
Max. |
Variation (%) |
||
|
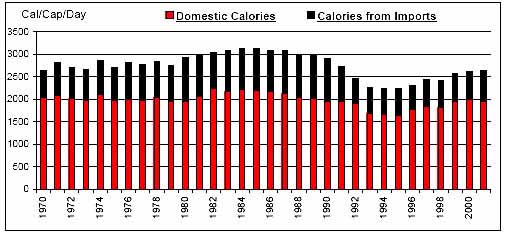
Per Caput Consumption (Cal/Day) |
2756 |
3039 |
2468 |
2496 |
2742 |
2228 |
3128 |
10 |
|
|
Imports / Consumption (%) |
Wheat |
100.00 |
100.00 |
100.00 |
100.00 |
100.00 |
100.00 |
100.00 |
0 |
|
Coarse Grains |
78.38 |
85.51 |
66.99 |
41.41 |
71.54 |
24.32 |
91.91 |
27 |
|
|
Rice |
33.78 |
29.28 |
50.51 |
52.02 |
38.93 |
24.03 |
68.44 |
32 |
|
|
Dairy |
40.06 |
29.27 |
35.34 |
33.67 |
34.61 |
26.59 |
48.34 |
17 |
|
|
Meat |
12.55 |
17.15 |
15.99 |
18.19 |
15.69 |
7.44 |
23.94 |
27 |
|
|
Sugar |
N/A |
N/A |
N/A |
N/A |
N/A |
0.00 |
0.00 |
N/A |
|
|
Fruits and Vegetables |
16.85 |
9.41 |
9.92 |
9.34 |
11.82 |
5.69 |
25.18 |
38 |
|
|
Oils |
73.82 |
74.36 |
73.58 |
70.72 |
73.36 |
66.65 |
81.21 |
5 |
|
|
Per Caput Calories from Imports (Cal/Cap/Day) |
741 |
925 |
667 |
612 |
760 |
544 |
980 |
19 |
|
|
Aid + Commercial Food Import Bill (US$ 000) |
538,206 |
827,466 |
645,640 |
620,839 |
664,237 |
241,301 |
974,639 |
27 |
|
|
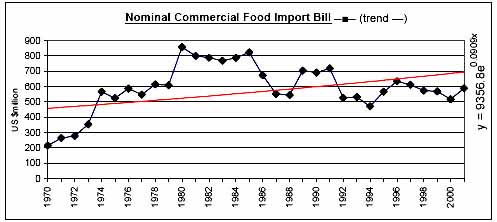
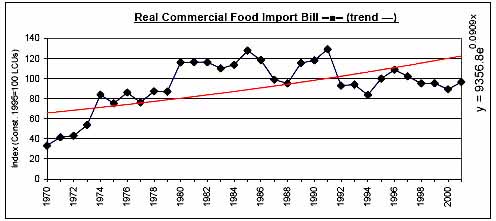
Commercial Food Import Bill (US$ 000) |
456,550 |
729,978 |
584,628 |
582,452 |
589,617 |
215,594 |
856,221 |
27 |
|
|
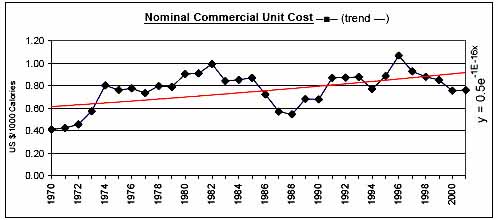
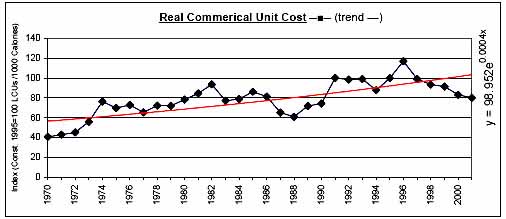
Commerical Unit Cost (US $/1000 calories) |
0.65 |
0.79 |
0.83 |
0.87 |
0.77 |
0.41 |
1.07 |
21 |
|
|
Commercial Food Import Bill / GDP (%) |
4.00 |
4.10 |
3.79 |
3.77 |
3.95 |
2.50 |
6.50 |
22 |
|
|
Comm. Fd. Imp. Bill / Total Merchandise Imp. Bill (%) |
16.38 |
9.76 |
19.94 |
13.73 |
14.48 |
7.20 |
26.86 |
35 |
|
|
Comm. Fd. Imp. Bill / Total Merchandise Exp. Bill (%) |
20.35 |
12.46 |
31.17 |
34.42 |
22.55 |
9.88 |
46.98 |
48 |
|
|
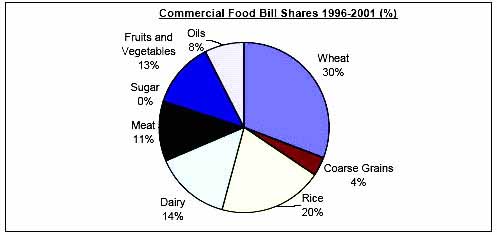
Commercial Food Value Bill Shares (%) |
Wheat |
29.97 |
32.28 |
26.40 |
30.92 |
30.20 |
22.13 |
39.67 |
17 |
|
Coarse Grains |
9.96 |
11.28 |
6.93 |
3.57 |
8.61 |
1.48 |
16.96 |
52 |
|
|
Rice |
11.29 |
9.86 |
14.70 |
19.55 |
13.03 |
2.76 |
24.81 |
41 |
|
|
Dairy |
15.80 |
12.28 |
17.91 |
14.44 |
14.84 |
10.18 |
22.31 |
23 |
|
|
Meat |
8.91 |
14.01 |
10.88 |
11.39 |
11.34 |
6.67 |
16.32 |
28 |
|
|
Sugar |
N/A |
N/A |
N/A |
N/A |
N/A |
0.00 |
0.00 |
N/A |
|
|
Fruits and Vegetables |
13.51 |
11.39 |
13.60 |
12.57 |
12.69 |
9.70 |
16.81 |
16 |
|
|
Oils |
10.55 |
8.89 |
9.58 |
7.56 |
9.29 |
5.52 |
15.16 |
26 |
|
|
|
|
|
|
|
|
|
|
![]()
![]()
![]()