![]()
![]()
![]()
|
Cote d'Ivoire |
Mean |
1970-2001 |
|||||||
|
1970-1979 |
1980-1989 |
1990-1995 |
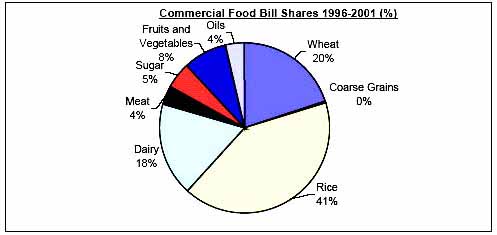
1996-2001 |
Mean |
Min. |
Max. |
Variation (%) |
||
|
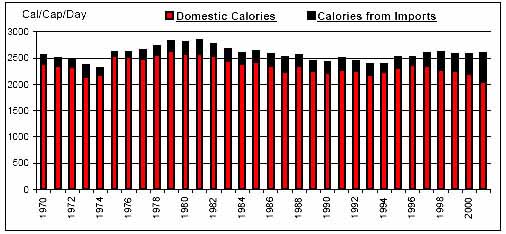
Per Caput Consumption (Cal/Day) |
2564 |
2645 |
2444 |
2583 |
2570 |
2313 |
2838 |
5 |
|
|
Imports / Consumption (%) |
Wheat |
100.00 |
100.00 |
100.00 |
100.00 |
100.00 |
100.00 |
100.00 |
0 |
|
Coarse Grains |
1.32 |
2.21 |
2.09 |
0.81 |
1.65 |
0.01 |
6.19 |
107 |
|
|
Rice |
17.17 |
40.53 |
34.55 |
42.38 |
32.46 |
0.33 |
61.65 |
42 |
|
|
Dairy |
89.28 |
91.81 |
85.84 |
84.82 |
88.59 |
78.43 |
94.48 |
4 |
|
|
Meat |
7.63 |
13.30 |
16.30 |
6.12 |
10.75 |
1.93 |
28.74 |
69 |
|
|
Sugar |
54.14 |
0.85 |
1.93 |
3.46 |
18.19 |
0.21 |
100.00 |
198 |
|
|
Fruits and Vegetables |
1.77 |
2.30 |
1.80 |
2.08 |
2.00 |
0.81 |
2.61 |
21 |
|
|
Oils |
1.76 |
1.30 |
2.19 |
3.54 |
2.03 |
0.50 |
5.93 |
69 |
|
|
Per Caput Calories from Imports (Cal/Cap/Day) |
154 |
229 |
195 |
332 |
219 |
75 |
541 |
40 |
|
|
Aid + Commercial Food Import Bill (US$ 000) |
109,273 |
262,507 |
275,098 |
398,278 |
242,439 |
41,924 |
550,828 |
49 |
|
|
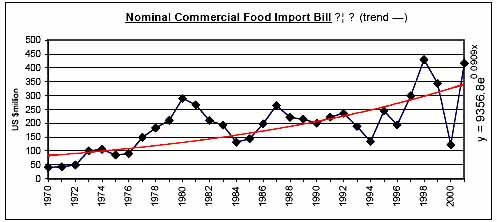
Commercial Food Import Bill (US$ 000) |
105,684 |
213,362 |
204,585 |
301,136 |
194,524 |
40,592 |
429,957 |
50 |
|
|
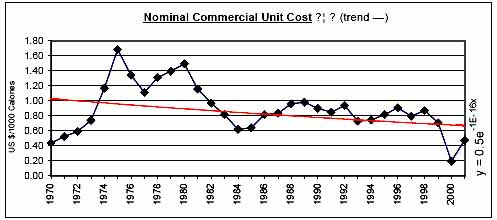
Commerical Unit Cost (US $/1000 calories) |
1.03 |
0.93 |
0.83 |
0.66 |
0.89 |
0.19 |
1.68 |
36 |
|
|
Commercial Food Import Bill / GDP (%) |
1.40 |
2.08 |
1.86 |
2.19 |
1.85 |
0.76 |
3.05 |
34 |
|
|
Comm. Fd. Imp. Bill / Total Merchandise Imp. Bill (%) |
9.68 |
10.03 |
9.06 |
7.75 |
9.31 |
3.05 |
14.08 |
21 |
|
|
Comm. Fd. Imp. Bill / Total Merchandise Exp. Bill (%) |
8.31 |
7.78 |
6.80 |
7.19 |
7.65 |
3.12 |
11.62 |
26 |
|
|
Commercial Food Value Bill Shares (%) |
Wheat |
14.50 |
19.49 |
20.30 |
19.98 |
18.17 |
5.78 |
34.57 |
33 |
|
Coarse Grains |
0.59 |
0.94 |
1.19 |
0.33 |
0.76 |
0.00 |
2.60 |
91 |
|
|
Rice |
20.47 |
22.16 |
23.91 |
41.26 |
25.54 |
1.15 |
69.89 |
61 |
|
|
Dairy |
24.36 |
31.30 |
23.18 |
17.74 |
25.07 |
8.50 |
37.08 |
28 |
|
|
Meat |
8.77 |
10.49 |
10.11 |
3.84 |
8.63 |
1.92 |
16.79 |
54 |
|
|
Sugar |
15.97 |
1.84 |
5.12 |
4.87 |
7.44 |
0.73 |
33.15 |
114 |
|
|
Fruits and Vegetables |
12.20 |
11.45 |
12.13 |
8.45 |
11.25 |
4.32 |
15.00 |
24 |
|
|
Oils |
3.14 |
2.34 |
4.06 |
3.54 |
3.14 |
0.97 |
9.04 |
51 |
|
|
|
|
|
|
|
|
|
|
![]()
![]()
![]()