![]()
![]()
![]()
|
Congo, Dem R |
Mean |
1970-2001 |
|||||||
|
1970-1979 |
1980-1989 |
1990-1995 |
1996-2001 |
Mean |
Min. |
Max. |
Variation (%) |
||
|
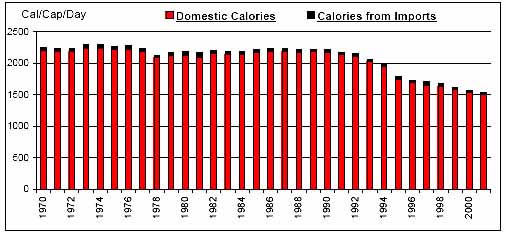
Per Caput Consumption (Cal/Day) |
2238 |
2204 |
2056 |
1635 |
2080 |
1535 |
2291 |
12 |
|
|
Imports / Consumption (%) |
Wheat |
97.50 |
97.80 |
96.36 |
96.66 |
97.22 |
94.87 |
99.10 |
1 |
|
Coarse Grains |
20.78 |
12.86 |
4.32 |
0.85 |
11.48 |
0.12 |
33.80 |
83 |
|
|
Rice |
13.30 |
13.96 |
14.61 |
12.71 |
13.64 |
4.76 |
20.74 |
30 |
|
|
Dairy |
91.84 |
88.84 |
76.79 |
84.23 |
86.65 |
66.66 |
95.50 |
8 |
|
|
Meat |
7.97 |
12.40 |
14.91 |
9.77 |
10.99 |
3.66 |
21.82 |
42 |
|
|
Sugar |
1.80 |
2.03 |
0.75 |
1.54 |
1.63 |
0.07 |
3.71 |
64 |
|
|
Fruits and Vegetables |
0.51 |
0.28 |
0.43 |
1.17 |
0.55 |
0.18 |
1.33 |
67 |
|
|
Oils |
0.11 |
0.01 |
1.27 |
3.49 |
0.93 |
0.00 |
4.57 |
149 |
|
|
Per Caput Calories from Imports (Cal/Cap/Day) |
53 |
50 |
35 |
36 |
46 |
26 |
74 |
26 |
|
|
Aid + Commercial Food Import Bill (US$ 000) |
95,156 |
161,008 |
165,029 |
153,278 |
139,734 |
43,162 |
203,606 |
32 |
|
|
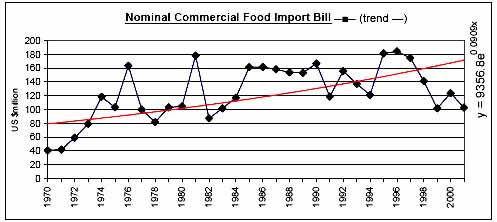
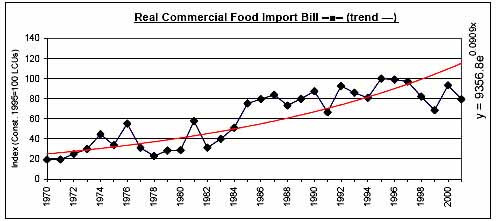
Commercial Food Import Bill (US$ 000) |
89,232 |
137,803 |
146,883 |
138,097 |
124,382 |
41,047 |
184,448 |
32 |
|
|
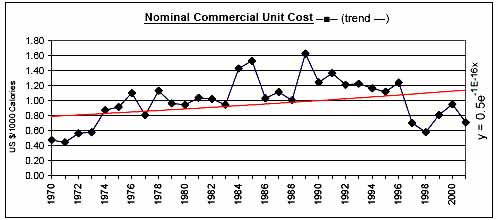
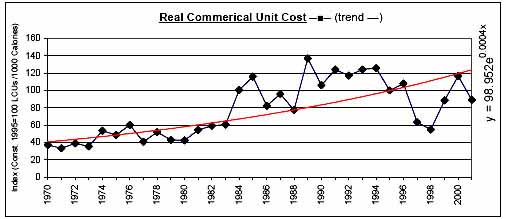
Commerical Unit Cost (US $/1000 calories) |
0.79 |
1.17 |
1.22 |
0.83 |
1.00 |
0.45 |
1.63 |
30 |
|
|
Commercial Food Import Bill / GDP (%) |
0.99 |
1.47 |
2.01 |
2.47 |
1.61 |
0.48 |
2.94 |
42 |
|
|
Comm. Fd. Imp. Bill / Total Merchandise Imp. Bill (%) |
11.13 |
18.22 |
31.03 |
30.19 |
20.65 |
6.80 |
46.51 |
51 |
|
|
Comm. Fd. Imp. Bill / Total Merchandise Exp. Bill (%) |
9.21 |
13.87 |
28.80 |
30.97 |
18.42 |
5.58 |
42.70 |
61 |
|
|
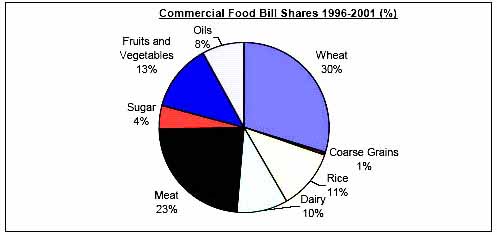
Commercial Food Value Bill Shares (%) |
Wheat |
19.23 |
16.11 |
23.90 |
29.70 |
21.09 |
4.67 |
39.27 |
39 |
|
Coarse Grains |
19.86 |
23.65 |
5.28 |
0.56 |
14.69 |
0.00 |
60.08 |
94 |
|
|
Rice |
8.03 |
6.09 |
18.69 |
11.39 |
10.05 |
0.00 |
28.02 |
78 |
|
|
Dairy |
19.39 |
14.89 |
8.15 |
9.74 |
14.07 |
4.95 |
24.01 |
39 |
|
|
Meat |
19.72 |
27.51 |
31.37 |
23.36 |
25.02 |
7.15 |
46.86 |
41 |
|
|
Sugar |
3.74 |
4.67 |
2.70 |
4.48 |
3.97 |
0.45 |
10.29 |
62 |
|
|
Fruits and Vegetables |
9.42 |
7.05 |
7.17 |
12.63 |
8.86 |
3.90 |
16.11 |
34 |
|
|
Oils |
0.61 |
0.03 |
2.74 |
8.14 |
2.24 |
0.00 |
12.32 |
147 |
|
|
|
|
|
|
|
|
|
|
![]()
![]()
![]()