![]()
![]()
![]()
|
Comoros |
Mean |
1970-2001 |
|||||||
|
1970-1979 |
1980-1989 |
1990-1995 |
1996-2001 |
Mean |
Min. |
Max. |
Variation (%) |
||
|
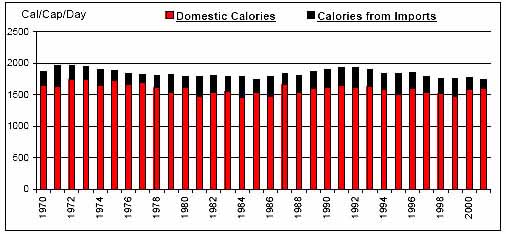
Per Caput Consumption (Cal/Day) |
1878 |
1798 |
1887 |
1776 |
1835 |
1733 |
1962 |
4 |
|
|
Imports / Consumption (%) |
Wheat |
100.00 |
100.00 |
100.00 |
100.00 |
100.00 |
100.00 |
100.00 |
0 |
|
Coarse Grains |
N/A |
4.92 |
0.17 |
0.28 |
1.62 |
0.00 |
29.57 |
370 |
|
|
Rice |
55.87 |
62.58 |
65.69 |
61.96 |
60.95 |
42.52 |
71.43 |
14 |
|
|
Dairy |
24.12 |
41.41 |
47.52 |
32.89 |
35.56 |
18.10 |
60.05 |
33 |
|
|
Meat |
14.11 |
37.38 |
56.75 |
54.72 |
36.99 |
1.09 |
65.33 |
54 |
|
|
Sugar |
100.00 |
100.00 |
100.00 |
100.00 |
100.00 |
100.00 |
100.00 |
0 |
|
|
Fruits and Vegetables |
N/A |
1.09 |
1.51 |
0.97 |
0.80 |
0.00 |
2.22 |
84 |
|
|
Oils |
N/A |
0.53 |
1.04 |
1.08 |
0.56 |
0.00 |
2.01 |
103 |
|
|
Per Caput Calories from Imports (Cal/Cap/Day) |
216 |
255 |
287 |
225 |
243 |
129 |
332 |
24 |
|
|
Aid + Commercial Food Import Bill (US$ 000) |
5,314 |
12,423 |
19,645 |
17,388 |
12,486 |
2,198 |
25,995 |
52 |
|
|
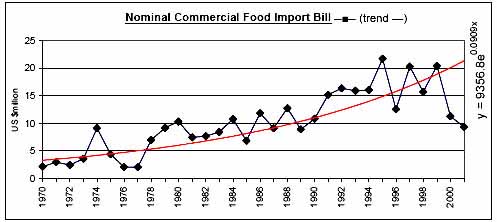
Commercial Food Import Bill (US$ 000) |
4,521 |
9,427 |
16,028 |
14,952 |
10,168 |
2,078 |
21,731 |
54 |
|
|
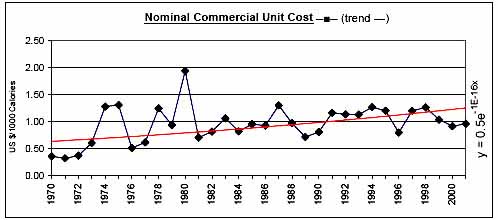
Commerical Unit Cost (US $/1000 calories) |
0.76 |
1.03 |
1.12 |
1.03 |
0.96 |
0.32 |
1.94 |
35 |
|
|
Commercial Food Import Bill / GDP (%) |
2.44 |
3.47 |
5.28 |
4.62 |
3.70 |
1.06 |
6.98 |
42 |
|
|
Comm. Fd. Imp. Bill / Total Merchandise Imp. Bill (%) |
26.14 |
24.54 |
26.78 |
25.76 |
25.69 |
12.60 |
37.82 |
27 |
|
|
Comm. Fd. Imp. Bill / Total Merchandise Exp. Bill (%) |
53.63 |
68.19 |
101.37 |
156.57 |
86.43 |
22.54 |
233.90 |
69 |
|
|
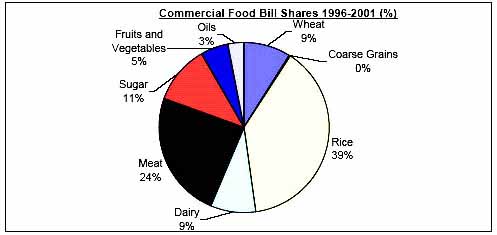
Commercial Food Value Bill Shares (%) |
Wheat |
6.64 |
6.13 |
7.09 |
8.99 |
7.01 |
0.07 |
15.16 |
44 |
|
Coarse Grains |
N/A |
N/A |
0.01 |
0.04 |
0.01 |
0.00 |
0.09 |
279 |
|
|
Rice |
57.21 |
42.43 |
32.67 |
38.66 |
44.51 |
0.00 |
84.81 |
44 |
|
|
Dairy |
7.15 |
12.20 |
11.78 |
8.82 |
9.91 |
2.39 |
28.09 |
52 |
|
|
Meat |
16.23 |
21.22 |
30.22 |
23.95 |
21.86 |
0.92 |
67.37 |
64 |
|
|
Sugar |
12.76 |
11.58 |
11.29 |
11.34 |
11.85 |
5.92 |
24.10 |
31 |
|
|
Fruits and Vegetables |
N/A |
5.48 |
5.36 |
5.10 |
3.67 |
0.00 |
8.27 |
78 |
|
|
Oils |
N/A |
0.96 |
1.57 |
3.11 |
1.18 |
0.00 |
5.79 |
128 |
|
|
|
|
|
|
|
|
|
|
![]()
![]()
![]()