![]()
![]()
![]()
|
Chad |
Mean |
1970-2001 |
|||||||
|
1970-1979 |
1980-1989 |
1990-1995 |
1996-2001 |
Mean |
Min. |
Max. |
Variation (%) |
||
|
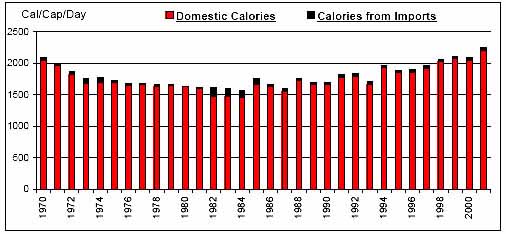
Per Caput Consumption (Cal/Day) |
1787 |
1650 |
1819 |
2058 |
1801 |
1567 |
2245 |
10 |
|
|
Imports / Consumption (%) |
Wheat |
65.02 |
82.69 |
93.92 |
93.12 |
81.23 |
46.27 |
98.48 |
20 |
|
Coarse Grains |
1.93 |
8.79 |
0.41 |
0.29 |
3.48 |
0.00 |
31.67 |
216 |
|
|
Rice |
4.49 |
28.74 |
15.20 |
0.88 |
13.40 |
0.00 |
77.78 |
150 |
|
|
Dairy |
3.77 |
7.55 |
3.42 |
1.99 |
4.55 |
0.68 |
29.52 |
127 |
|
|
Meat |
0.28 |
0.47 |
0.34 |
0.12 |
0.32 |
0.00 |
1.70 |
105 |
|
|
Sugar |
34.05 |
1.96 |
3.69 |
6.98 |
13.25 |
0.00 |
59.72 |
148 |
|
|
Fruits and Vegetables |
0.71 |
0.12 |
0.21 |
0.28 |
0.35 |
0.00 |
1.51 |
127 |
|
|
Oils |
0.59 |
0.88 |
0.56 |
0.92 |
0.73 |
0.00 |
5.81 |
152 |
|
|
Per Caput Calories from Imports (Cal/Cap/Day) |
41 |
68 |
42 |
41 |
50 |
13 |
149 |
65 |
|
|
Aid + Commercial Food Import Bill (US$ 000) |
13,545 |
23,243 |
23,015 |
27,737 |
21,012 |
4,800 |
38,385 |
47 |
|
|
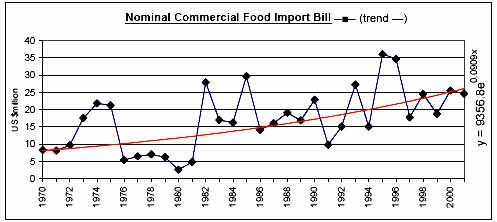
Commercial Food Import Bill (US$ 000) |
11,195 |
16,452 |
21,048 |
24,342 |
17,151 |
2,594 |
36,082 |
52 |
|
|
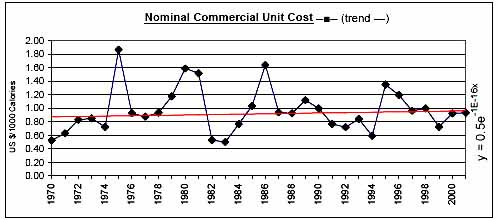
Commerical Unit Cost (US $/1000 calories) |
0.93 |
1.06 |
0.88 |
0.96 |
0.97 |
0.50 |
1.87 |
34 |
|
|
Commercial Food Import Bill / GDP (%) |
0.93 |
1.33 |
1.18 |
1.15 |
1.14 |
0.26 |
2.85 |
50 |
|
|
Comm. Fd. Imp. Bill / Total Merchandise Imp. Bill (%) |
12.34 |
8.88 |
7.22 |
7.29 |
9.35 |
2.84 |
25.64 |
66 |
|
|
Comm. Fd. Imp. Bill / Total Merchandise Exp. Bill (%) |
18.97 |
11.86 |
12.45 |
11.52 |
14.13 |
1.78 |
39.65 |
63 |
|
|
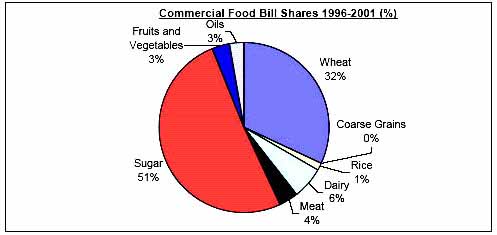
Commercial Food Value Bill Shares (%) |
Wheat |
14.97 |
22.74 |
37.44 |
31.83 |
24.77 |
0.00 |
51.83 |
68 |
|
Coarse Grains |
6.52 |
20.11 |
3.08 |
0.11 |
8.92 |
0.00 |
79.61 |
230 |
|
|
Rice |
5.18 |
25.82 |
20.86 |
1.34 |
13.85 |
0.00 |
58.57 |
111 |
|
|
Dairy |
10.56 |
12.32 |
9.13 |
6.22 |
10.03 |
0.00 |
24.93 |
63 |
|
|
Meat |
2.34 |
8.21 |
4.79 |
3.68 |
4.88 |
0.00 |
20.52 |
104 |
|
|
Sugar |
53.98 |
7.39 |
20.57 |
50.83 |
32.57 |
0.00 |
77.79 |
79 |
|
|
Fruits and Vegetables |
4.22 |
1.48 |
3.09 |
3.23 |
2.96 |
0.00 |
9.78 |
99 |
|
|
Oils |
2.23 |
1.93 |
1.04 |
2.76 |
2.02 |
0.00 |
10.23 |
126 |
|
|
|
|
|
|
|
|
|
|
![]()
![]()
![]()