![]()
![]()
![]()
|
Gambia |
Mean |
1970-2001 |
|||||||
|
1970-1979 |
1980-1989 |
1990-1995 |
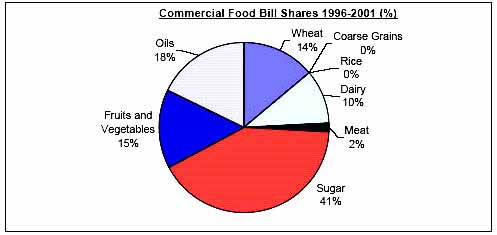
1996-2001 |
Mean |
Min. |
Max. |
Variation (%) |
||
|
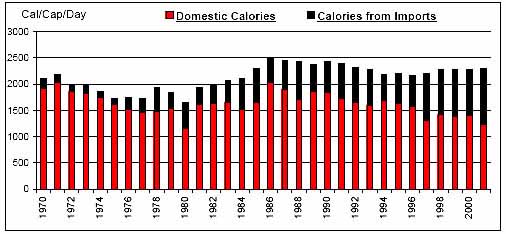
Per Caput Consumption (Cal/Day) |
1910 |
2180 |
2302 |
2248 |
2131 |
1643 |
2513 |
11 |
|
|
Imports / Consumption (%) |
Wheat |
100.00 |
100.00 |
100.00 |
100.00 |
100.00 |
100.00 |
100.00 |
0 |
|
Coarse Grains |
7.34 |
3.40 |
0.62 |
0.05 |
3.48 |
0.00 |
32.65 |
254 |
|
|
Rice |
38.11 |
57.76 |
76.97 |
77.20 |
58.87 |
15.83 |
87.88 |
34 |
|
|
Dairy |
37.32 |
67.51 |
54.24 |
74.94 |
56.98 |
21.99 |
90.31 |
31 |
|
|
Meat |
1.91 |
7.34 |
12.91 |
13.81 |
7.90 |
0.93 |
28.77 |
103 |
|
|
Sugar |
100.00 |
100.00 |
100.00 |
100.00 |
100.00 |
100.00 |
100.00 |
0 |
|
|
Fruits and Vegetables |
11.98 |
22.56 |
54.68 |
65.70 |
33.36 |
8.64 |
72.22 |
68 |
|
|
Oils |
0.22 |
4.22 |
12.64 |
26.39 |
8.71 |
0.04 |
34.72 |
120 |
|
|
Per Caput Calories from Imports (Cal/Cap/Day) |
216 |
511 |
612 |
857 |
503 |
113 |
1063 |
51 |
|
|
Aid + Commercial Food Import Bill (US$ 000) |
8,509 |
30,722 |
61,334 |
68,585 |
36,619 |
2,574 |
90,737 |
70 |
|
|
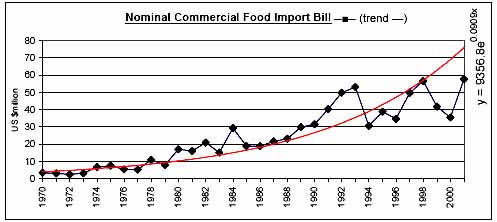
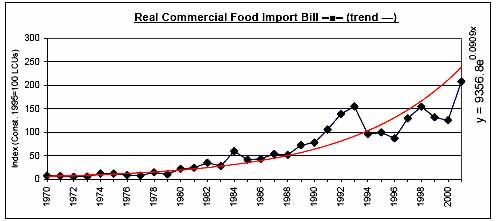
Commercial Food Import Bill (US$ 000) |
5,580 |
21,066 |
40,723 |
45,987 |
24,585 |
2,508 |
57,599 |
70 |
|
|
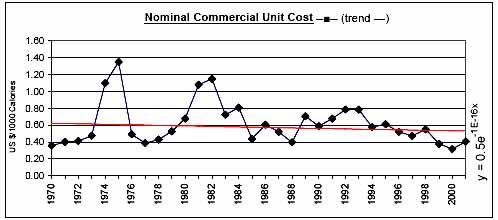
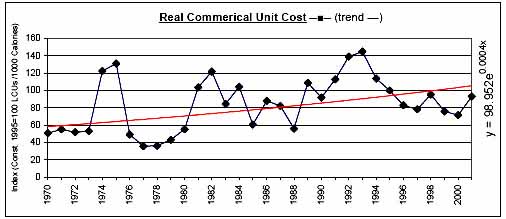
Commerical Unit Cost (US $/1000 calories) |
0.59 |
0.71 |
0.67 |
0.44 |
0.62 |
0.32 |
1.35 |
41 |
|
|
Commercial Food Import Bill / GDP (%) |
3.61 |
8.46 |
12.50 |
11.31 |
8.23 |
2.14 |
15.64 |
48 |
|
|
Comm. Fd. Imp. Bill / Total Merchandise Imp. Bill (%) |
12.19 |
17.51 |
18.20 |
21.91 |
16.80 |
7.19 |
29.90 |
34 |
|
|
Comm. Fd. Imp. Bill / Total Merchandise Exp. Bill (%) |
17.61 |
64.54 |
104.41 |
181.70 |
79.32 |
11.27 |
312.05 |
88 |
|
|
Commercial Food Value Bill Shares (%) |
Wheat |
9.66 |
10.04 |
15.76 |
13.77 |
11.69 |
2.37 |
23.17 |
42 |
|
Coarse Grains |
2.70 |
0.87 |
0.16 |
0.06 |
1.16 |
0.00 |
18.23 |
309 |
|
|
Rice |
26.60 |
3.41 |
N/A |
N/A |
9.38 |
0.00 |
67.89 |
202 |
|
|
Dairy |
13.68 |
13.97 |
11.43 |
10.43 |
12.74 |
4.64 |
22.43 |
34 |
|
|
Meat |
3.10 |
4.25 |
2.87 |
1.57 |
3.13 |
0.43 |
11.26 |
82 |
|
|
Sugar |
30.58 |
49.28 |
42.22 |
41.34 |
40.62 |
8.08 |
71.64 |
32 |
|
|
Fruits and Vegetables |
12.43 |
11.80 |
18.60 |
15.09 |
13.89 |
5.62 |
23.28 |
32 |
|
|
Oils |
1.26 |
6.38 |
8.96 |
17.74 |
7.39 |
0.00 |
27.57 |
96 |
|
|
|
|
|
|
|
|
|
|
![]()
![]()
![]()