![]()
![]()
![]()
|
Guinea |
Mean |
1970-2001 |
|||||||
|
1970-1979 |
1980-1989 |
1990-1995 |
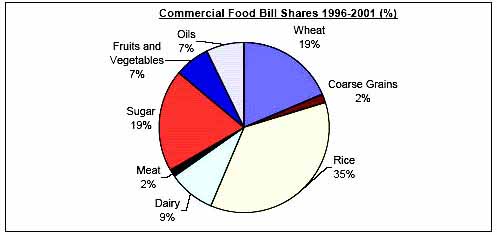
1996-2001 |
Mean |
Min. |
Max. |
Variation (%) |
||
|
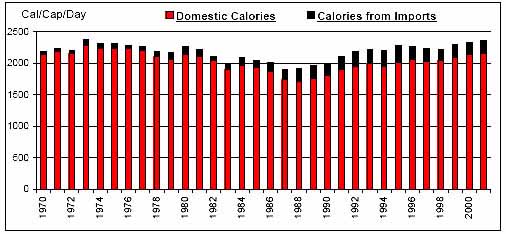
Per Caput Consumption (Cal/Day) |
2251 |
2052 |
2161 |
2282 |
2178 |
1903 |
2371 |
6 |
|
|
Imports / Consumption (%) |
Wheat |
100.00 |
100.00 |
100.00 |
100.00 |
100.00 |
100.00 |
100.00 |
0 |
|
Coarse Grains |
2.47 |
0.70 |
1.22 |
4.66 |
2.09 |
0.00 |
11.86 |
155 |
|
|
Rice |
7.88 |
20.67 |
30.56 |
21.45 |
18.67 |
3.85 |
38.96 |
54 |
|
|
Dairy |
10.73 |
18.00 |
30.86 |
22.92 |
19.06 |
4.53 |
40.74 |
51 |
|
|
Meat |
0.10 |
5.98 |
8.95 |
3.44 |
4.22 |
0.00 |
12.20 |
100 |
|
|
Sugar |
61.02 |
9.89 |
17.92 |
20.90 |
29.44 |
0.82 |
100.00 |
120 |
|
|
Fruits and Vegetables |
0.02 |
0.34 |
0.91 |
1.17 |
0.50 |
0.00 |
1.49 |
100 |
|
|
Oils |
1.80 |
2.55 |
6.17 |
5.70 |
3.59 |
0.39 |
9.20 |
67 |
|
|
Per Caput Calories from Imports (Cal/Cap/Day) |
70 |
138 |
231 |
199 |
146 |
44 |
270 |
47 |
|
|
Aid + Commercial Food Import Bill (US$ 000) |
20,099 |
57,386 |
126,475 |
123,131 |
71,015 |
7,500 |
175,615 |
69 |
|
|
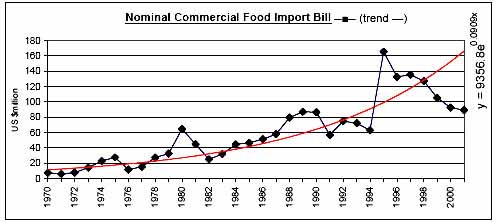
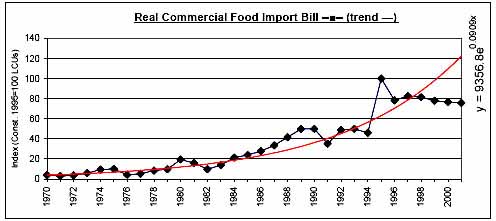
Commercial Food Import Bill (US$ 000) |
17,453 |
53,468 |
86,539 |
113,850 |
59,735 |
6,310 |
165,187 |
70 |
|
|
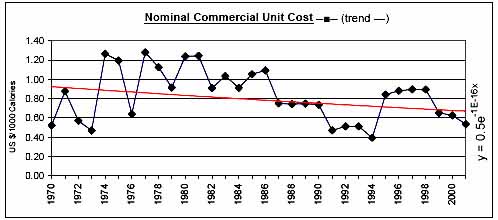
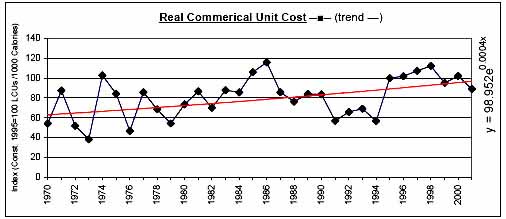
Commerical Unit Cost (US $/1000 calories) |
0.89 |
0.97 |
0.58 |
0.75 |
0.83 |
0.40 |
1.28 |
32 |
|
|
Commercial Food Import Bill / GDP (%) |
0.94 |
2.30 |
2.71 |
2.83 |
2.05 |
0.39 |
4.68 |
51 |
|
|
Comm. Fd. Imp. Bill / Total Merchandise Imp. Bill (%) |
9.59 |
12.37 |
11.79 |
12.20 |
11.36 |
4.14 |
22.02 |
31 |
|
|
Comm. Fd. Imp. Bill / Total Merchandise Exp. Bill (%) |
13.18 |
9.80 |
12.72 |
16.05 |
12.57 |
4.95 |
25.41 |
40 |
|
|
Commercial Food Value Bill Shares (%) |
Wheat |
7.09 |
15.73 |
23.52 |
18.54 |
15.02 |
0.00 |
29.09 |
55 |
|
Coarse Grains |
4.22 |
0.84 |
0.33 |
1.73 |
1.97 |
0.00 |
14.50 |
169 |
|
|
Rice |
53.56 |
51.82 |
14.85 |
36.12 |
42.49 |
0.00 |
83.51 |
49 |
|
|
Dairy |
7.58 |
6.67 |
14.03 |
8.83 |
8.74 |
3.07 |
22.00 |
52 |
|
|
Meat |
0.21 |
3.44 |
4.56 |
1.55 |
2.29 |
0.00 |
8.43 |
105 |
|
|
Sugar |
19.28 |
13.04 |
22.61 |
19.26 |
17.95 |
4.18 |
32.36 |
48 |
|
|
Fruits and Vegetables |
0.39 |
4.94 |
11.01 |
6.84 |
5.01 |
0.00 |
14.28 |
89 |
|
|
Oils |
7.68 |
3.52 |
9.10 |
7.12 |
6.54 |
0.00 |
15.37 |
58 |
|
|
|
|
|
|
|
|
|
|
![]()
![]()
![]()