![]()
![]()
![]()
|
Guinea-Bissau |
Mean |
1970-2001 |
|||||||
|
1970-1979 |
1980-1989 |
1990-1995 |
1996-2001 |
Mean |
Min. |
Max. |
Variation (%) |
||
|
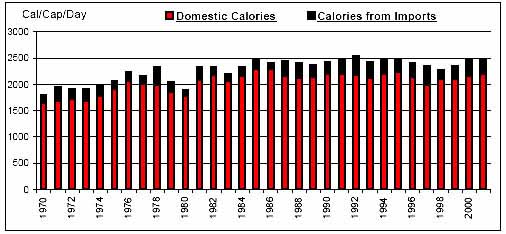
Per Caput Consumption (Cal/Day) |
2039 |
2323 |
2476 |
2392 |
2276 |
1802 |
2543 |
9 |
|
|
Imports / Consumption (%) |
Wheat |
100.00 |
100.00 |
100.00 |
100.00 |
100.00 |
100.00 |
100.00 |
0 |
|
Coarse Grains |
11.76 |
8.17 |
1.48 |
1.35 |
6.76 |
0.15 |
33.73 |
127 |
|
|
Rice |
35.29 |
22.08 |
32.19 |
38.80 |
31.24 |
11.83 |
51.70 |
38 |
|
|
Dairy |
33.81 |
22.15 |
22.78 |
12.25 |
24.06 |
10.42 |
41.54 |
41 |
|
|
Meat |
4.13 |
0.90 |
3.27 |
3.51 |
2.84 |
0.16 |
8.89 |
77 |
|
|
Sugar |
30.38 |
32.44 |
27.52 |
49.75 |
34.12 |
13.65 |
68.55 |
34 |
|
|
Fruits and Vegetables |
3.73 |
0.85 |
1.03 |
1.18 |
1.84 |
0.20 |
7.86 |
108 |
|
|
Oils |
0.46 |
2.23 |
5.56 |
4.68 |
2.76 |
0.21 |
9.17 |
87 |
|
|
Per Caput Calories from Imports (Cal/Cap/Day) |
202 |
193 |
284 |
272 |
228 |
122 |
368 |
30 |
|
|
Aid + Commercial Food Import Bill (US$ 000) |
10,918 |
14,522 |
25,838 |
25,735 |
17,620 |
4,875 |
32,888 |
48 |
|
|
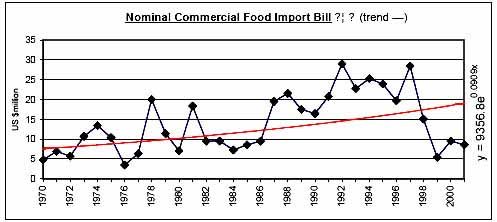
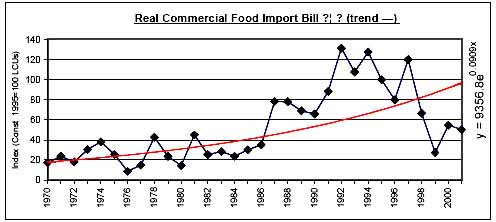
Commercial Food Import Bill (US$ 000) |
9,295 |
12,842 |
23,060 |
14,463 |
13,953 |
3,460 |
29,076 |
53 |
|
|
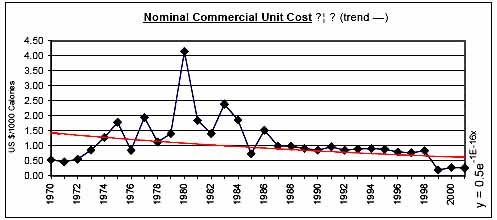
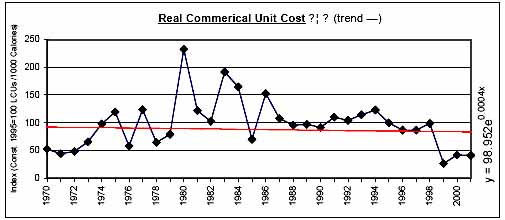
Commerical Unit Cost (US $/1000 calories) |
1.08 |
1.68 |
0.90 |
0.52 |
1.13 |
0.19 |
4.14 |
67 |
|
|
Commercial Food Import Bill / GDP (%) |
5.79 |
4.95 |
7.09 |
4.25 |
5.48 |
1.79 |
9.67 |
40 |
|
|
Comm. Fd. Imp. Bill / Total Merchandise Imp. Bill (%) |
22.71 |
24.33 |
31.97 |
19.60 |
24.37 |
7.79 |
40.67 |
38 |
|
|
Comm. Fd. Imp. Bill / Total Merchandise Exp. Bill (%) |
198.65 |
95.59 |
155.53 |
36.59 |
127.97 |
8.41 |
449.40 |
87 |
|
|
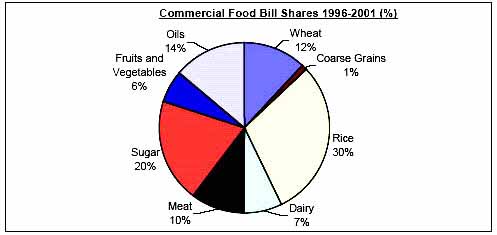
Commercial Food Value Bill Shares (%) |
Wheat |
3.79 |
3.43 |
2.46 |
11.99 |
4.96 |
0.00 |
24.47 |
110 |
|
Coarse Grains |
6.49 |
3.77 |
0.54 |
1.06 |
3.51 |
0.00 |
24.16 |
152 |
|
|
Rice |
48.72 |
67.80 |
73.25 |
29.81 |
55.74 |
0.00 |
81.50 |
43 |
|
|
Dairy |
16.18 |
6.36 |
6.07 |
7.26 |
9.54 |
0.00 |
27.92 |
77 |
|
|
Meat |
6.12 |
1.88 |
1.96 |
10.06 |
4.75 |
0.00 |
20.03 |
101 |
|
|
Sugar |
7.09 |
7.97 |
3.73 |
19.94 |
9.15 |
0.88 |
45.16 |
98 |
|
|
Fruits and Vegetables |
9.46 |
3.47 |
4.01 |
6.00 |
5.92 |
0.00 |
18.83 |
75 |
|
|
Oils |
2.15 |
5.31 |
7.97 |
13.87 |
6.43 |
0.00 |
24.97 |
97 |
|
|
|
|
|
|
|
|
|
|
![]()
![]()
![]()