![]()
![]()
![]()
|
Haiti |
Mean |
1970-2001 |
|||||||
|
1970-1979 |
1980-1989 |
1990-1995 |
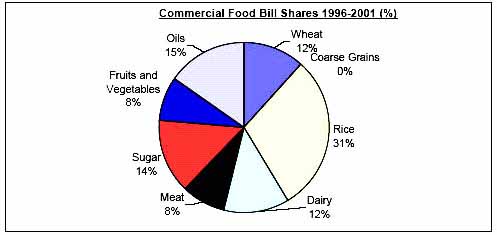
1996-2001 |
Mean |
Min. |
Max. |
Variation (%) |
||
|
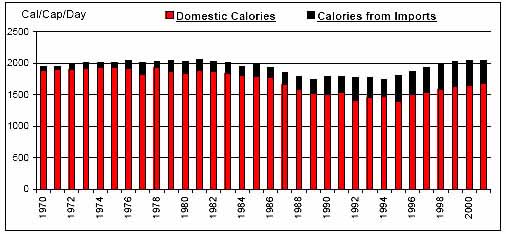
Per Caput Consumption (Cal/Day) |
2000 |
1936 |
1779 |
1984 |
1936 |
1734 |
2061 |
6 |
|
|
Imports / Consumption (%) |
Wheat |
100.00 |
100.00 |
100.00 |
100.00 |
100.00 |
100.00 |
100.00 |
0 |
|
Coarse Grains |
1.80 |
3.05 |
2.87 |
1.32 |
2.30 |
0.00 |
11.43 |
118 |
|
|
Rice |
7.38 |
11.54 |
55.02 |
65.19 |
28.45 |
0.00 |
68.08 |
92 |
|
|
Dairy |
32.92 |
55.65 |
44.90 |
51.64 |
45.78 |
24.43 |
70.70 |
25 |
|
|
Meat |
0.66 |
2.44 |
2.95 |
20.70 |
5.40 |
0.49 |
32.20 |
149 |
|
|
Sugar |
0.10 |
1.17 |
6.58 |
10.79 |
3.65 |
0.00 |
13.72 |
123 |
|
|
Fruits and Vegetables |
0.17 |
0.44 |
2.03 |
3.27 |
1.18 |
0.09 |
4.33 |
113 |
|
|
Oils |
21.26 |
26.85 |
53.92 |
62.69 |
36.90 |
11.44 |
64.76 |
50 |
|
|
Per Caput Calories from Imports (Cal/Cap/Day) |
100 |
180 |
315 |
388 |
219 |
57 |
413 |
53 |
|
|
Aid + Commercial Food Import Bill (US$ 000) |
37,773 |
103,335 |
212,022 |
312,428 |
142,431 |
10,070 |
352,089 |
76 |
|
|
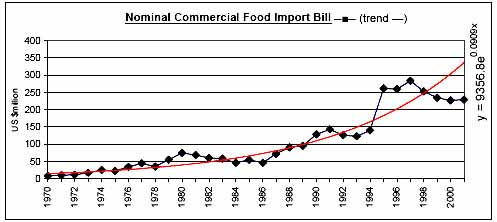
Commercial Food Import Bill (US$ 000) |
26,385 |
66,529 |
153,628 |
247,696 |
104,284 |
8,592 |
283,839 |
83 |
|
|
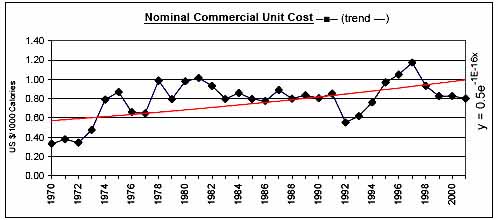
Commerical Unit Cost (US $/1000 calories) |
0.63 |
0.87 |
0.76 |
0.94 |
0.79 |
0.33 |
1.17 |
25 |
|
|
Commercial Food Import Bill / GDP (%) |
1.42 |
3.03 |
7.74 |
12.33 |
5.15 |
0.59 |
14.62 |
86 |
|
|
Comm. Fd. Imp. Bill / Total Merchandise Imp. Bill (%) |
18.66 |
17.58 |
41.66 |
30.31 |
24.82 |
10.53 |
55.65 |
46 |
|
|
Comm. Fd. Imp. Bill / Total Merchandise Exp. Bill (%) |
28.48 |
36.49 |
130.69 |
112.30 |
65.86 |
20.32 |
235.80 |
83 |
|
|
Commercial Food Value Bill Shares (%) |
Wheat |
43.81 |
33.50 |
23.36 |
11.60 |
30.71 |
6.56 |
62.25 |
48 |
|
Coarse Grains |
0.47 |
0.60 |
0.23 |
0.09 |
0.39 |
0.00 |
4.19 |
239 |
|
|
Rice |
5.03 |
3.63 |
19.45 |
29.78 |
11.94 |
0.00 |
37.28 |
102 |
|
|
Dairy |
18.58 |
21.16 |
12.72 |
12.30 |
17.11 |
8.93 |
30.44 |
31 |
|
|
Meat |
2.48 |
3.78 |
1.58 |
8.42 |
3.83 |
0.77 |
13.67 |
77 |
|
|
Sugar |
2.20 |
13.12 |
21.97 |
14.10 |
11.55 |
0.00 |
26.94 |
71 |
|
|
Fruits and Vegetables |
4.93 |
6.53 |
3.75 |
8.41 |
5.86 |
0.89 |
10.93 |
41 |
|
|
Oils |
22.50 |
17.69 |
16.94 |
15.30 |
18.60 |
8.76 |
36.58 |
35 |
|
|
|
|
|
|
|
|
|
|
![]()
![]()
![]()