![]()
![]()
![]()
|
Honduras |
Mean |
1970-2001 |
|||||||
|
1970-1979 |
1980-1989 |
1990-1995 |
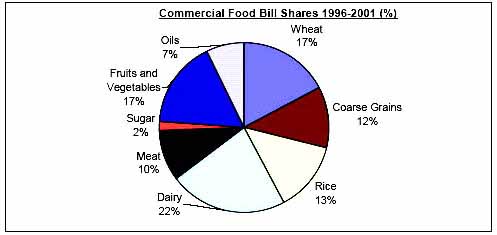
1996-2001 |
Mean |
Min. |
Max. |
Variation (%) |
||
|
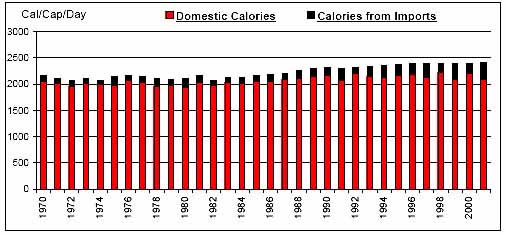
Per Caput Consumption (Cal/Day) |
2116 |
2172 |
2333 |
2392 |
2226 |
2065 |
2406 |
5 |
|
|
Imports / Consumption (%) |
Wheat |
98.78 |
99.24 |
99.42 |
99.37 |
99.15 |
98.33 |
99.62 |
0 |
|
Coarse Grains |
2.49 |
4.58 |
6.49 |
14.41 |
6.13 |
0.05 |
28.20 |
106 |
|
|
Rice |
17.41 |
6.60 |
22.13 |
68.26 |
24.45 |
1.90 |
92.51 |
104 |
|
|
Dairy |
11.14 |
15.01 |
11.93 |
13.34 |
12.91 |
6.88 |
18.04 |
23 |
|
|
Meat |
1.30 |
1.52 |
1.40 |
6.56 |
2.37 |
0.18 |
10.35 |
103 |
|
|
Sugar |
0.08 |
0.00 |
0.25 |
0.23 |
0.11 |
0.00 |
1.08 |
226 |
|
|
Fruits and Vegetables |
0.38 |
0.55 |
0.69 |
3.11 |
1.00 |
0.14 |
4.33 |
117 |
|
|
Oils |
12.87 |
8.36 |
11.48 |
11.34 |
10.91 |
2.01 |
28.53 |
49 |
|
|
Per Caput Calories from Imports (Cal/Cap/Day) |
111 |
128 |
185 |
241 |
154 |
85 |
319 |
40 |
|
|
Aid + Commercial Food Import Bill (US$ 000) |
25,399 |
52,749 |
76,158 |
172,480 |
71,041 |
10,892 |
210,110 |
78 |
|
|
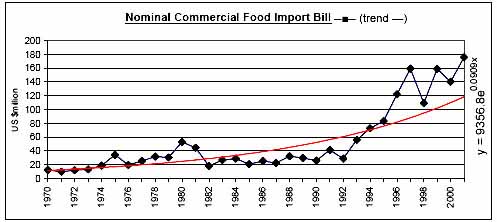
Commercial Food Import Bill (US$ 000) |
21,012 |
30,497 |
51,606 |
144,337 |
52,836 |
9,986 |
175,650 |
92 |
|
|
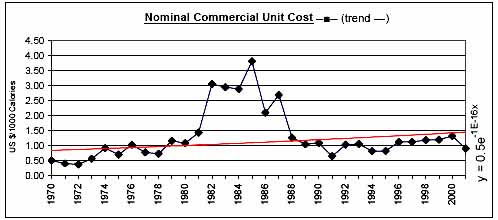
Commerical Unit Cost (US $/1000 calories) |
0.73 |
2.24 |
0.92 |
1.15 |
1.31 |
0.39 |
3.81 |
65 |
|
|
Commercial Food Import Bill / GDP (%) |
1.17 |
1.24 |
1.58 |
3.74 |
1.75 |
0.67 |
4.25 |
63 |
|
|
Comm. Fd. Imp. Bill / Total Merchandise Imp. Bill (%) |
5.31 |
3.36 |
4.07 |
5.85 |
4.57 |
2.36 |
8.56 |
32 |
|
|
Comm. Fd. Imp. Bill / Total Merchandise Exp. Bill (%) |
6.36 |
3.82 |
5.49 |
10.79 |
6.24 |
2.66 |
13.67 |
49 |
|
|
Commercial Food Value Bill Shares (%) |
Wheat |
31.79 |
5.52 |
18.18 |
17.25 |
18.30 |
0.00 |
40.40 |
68 |
|
Coarse Grains |
4.61 |
7.18 |
9.13 |
11.71 |
7.59 |
0.00 |
25.07 |
103 |
|
|
Rice |
7.37 |
3.90 |
8.22 |
13.12 |
7.52 |
0.65 |
18.23 |
64 |
|
|
Dairy |
21.95 |
41.65 |
30.30 |
22.76 |
29.82 |
13.89 |
62.27 |
39 |
|
|
Meat |
5.71 |
6.95 |
3.87 |
9.66 |
6.49 |
1.16 |
15.64 |
51 |
|
|
Sugar |
1.70 |
0.03 |
3.98 |
1.51 |
1.57 |
0.00 |
16.12 |
230 |
|
|
Fruits and Vegetables |
14.19 |
23.67 |
11.49 |
16.69 |
17.11 |
3.29 |
38.27 |
44 |
|
|
Oils |
12.68 |
11.10 |
14.83 |
7.30 |
11.58 |
3.25 |
21.33 |
43 |
|
|
|
|
|
|
|
|
|
|
![]()
![]()
![]()