![]()
![]()
![]()
|
Jamaica |
Mean |
1970-2001 |
|||||||
|
1970-1979 |
1980-1989 |
1990-1995 |
1996-2001 |
Mean |
Min. |
Max. |
Variation (%) |
||
|
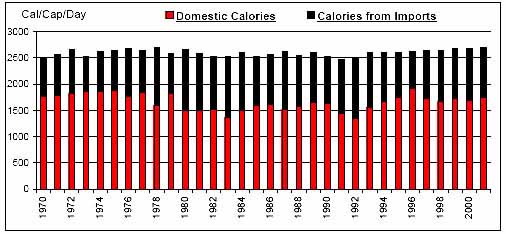
Per Caput Consumption (Cal/Day) |
2613 |
2577 |
2552 |
2662 |
2599 |
2464 |
2707 |
2 |
|
|
Imports / Consumption (%) |
Wheat |
100.00 |
100.00 |
100.00 |
100.00 |
100.00 |
100.00 |
100.00 |
0 |
|
Coarse Grains |
94.49 |
97.85 |
98.23 |
98.70 |
97.03 |
91.88 |
99.25 |
2 |
|
|
Rice |
97.21 |
95.21 |
99.58 |
99.96 |
97.55 |
90.67 |
99.97 |
3 |
|
|
Dairy |
71.76 |
71.28 |
68.71 |
75.63 |
71.76 |
56.85 |
79.38 |
7 |
|
|
Meat |
37.32 |
36.75 |
31.05 |
35.93 |
35.70 |
27.54 |
43.03 |
14 |
|
|
Sugar |
0.22 |
1.83 |
1.80 |
3.24 |
1.59 |
0.01 |
4.54 |
79 |
|
|
Fruits and Vegetables |
3.12 |
1.16 |
1.75 |
5.35 |
2.67 |
0.46 |
6.72 |
68 |
|
|
Oils |
16.25 |
29.80 |
32.40 |
16.68 |
23.59 |
6.19 |
44.32 |
45 |
|
|
Per Caput Calories from Imports (Cal/Cap/Day) |
814 |
1046 |
990 |
917 |
939 |
685 |
1182 |
15 |
|
|
Aid + Commercial Food Import Bill (US$ 000) |
118,395 |
183,671 |
196,311 |
260,338 |
180,017 |
62,635 |
282,319 |
32 |
|
|
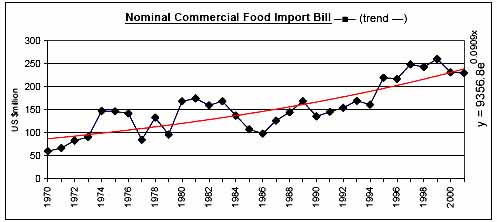
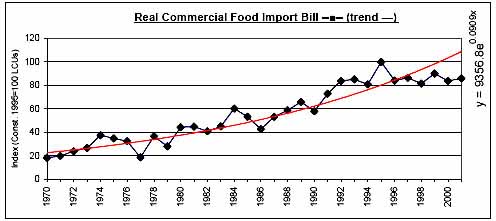
Commercial Food Import Bill (US$ 000) |
104,790 |
145,119 |
164,096 |
238,075 |
153,504 |
59,596 |
259,931 |
35 |
|
|
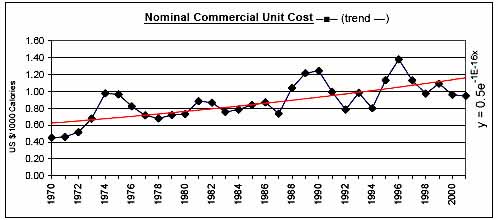
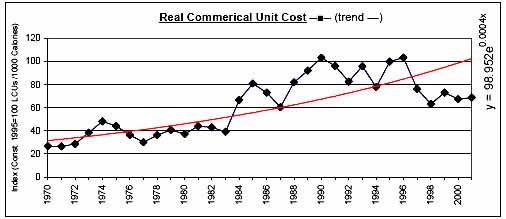
Commerical Unit Cost (US $/1000 calories) |
0.70 |
0.87 |
0.99 |
1.08 |
0.88 |
0.45 |
1.38 |
25 |
|
|
Commercial Food Import Bill / GDP (%) |
2.96 |
3.77 |
3.45 |
5.04 |
3.69 |
1.81 |
5.56 |
28 |
|
|
Comm. Fd. Imp. Bill / Total Merchandise Imp. Bill (%) |
12.81 |
11.11 |
7.74 |
7.70 |
10.37 |
6.98 |
15.69 |
26 |
|
|
Comm. Fd. Imp. Bill / Total Merchandise Exp. Bill (%) |
18.17 |
18.73 |
13.87 |
15.53 |
17.04 |
10.86 |
24.53 |
20 |
|
|
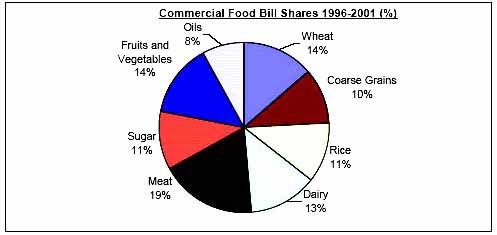
Commercial Food Value Bill Shares (%) |
Wheat |
20.41 |
13.76 |
8.77 |
13.70 |
14.89 |
1.23 |
24.97 |
44 |
|
Coarse Grains |
10.45 |
9.45 |
6.12 |
10.38 |
9.31 |
0.61 |
18.31 |
54 |
|
|
Rice |
14.46 |
13.44 |
16.38 |
11.34 |
13.92 |
7.81 |
23.25 |
24 |
|
|
Dairy |
15.72 |
16.38 |
17.43 |
13.32 |
15.80 |
10.34 |
26.58 |
21 |
|
|
Meat |
18.51 |
18.35 |
19.50 |
18.14 |
18.58 |
10.96 |
27.39 |
19 |
|
|
Sugar |
1.76 |
8.43 |
9.84 |
11.07 |
7.10 |
0.11 |
16.09 |
65 |
|
|
Fruits and Vegetables |
7.41 |
3.91 |
7.06 |
14.07 |
7.50 |
2.26 |
18.35 |
57 |
|
|
Oils |
11.28 |
16.28 |
14.91 |
7.99 |
12.91 |
4.74 |
24.40 |
39 |
|
|
|
|
|
|
|
|
|
|
![]()
![]()
![]()