![]()
![]()
![]()
|
Jordan |
Mean |
1970-2001 |
|||||||
|
1970-1979 |
1980-1989 |
1990-1995 |
1996-2001 |
Mean |
Min. |
Max. |
Variation (%) |
||
|
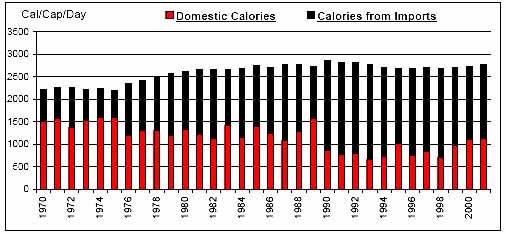
Per Caput Consumption (Cal/Day) |
2319 |
2698 |
2773 |
2710 |
2596 |
2198 |
2868 |
8 |
|
|
Imports / Consumption (%) |
Wheat |
69.31 |
84.22 |
89.05 |
95.40 |
82.56 |
35.08 |
97.78 |
18 |
|
Coarse Grains |
74.72 |
90.32 |
93.01 |
96.06 |
87.03 |
27.95 |
98.54 |
17 |
|
|
Rice |
100.00 |
100.00 |
100.00 |
100.00 |
100.00 |
100.00 |
100.00 |
0 |
|
|
Dairy |
57.80 |
81.56 |
66.74 |
50.86 |
65.60 |
38.57 |
85.06 |
23 |
|
|
Meat |
21.60 |
41.55 |
33.91 |
21.76 |
30.17 |
11.95 |
52.77 |
38 |
|
|
Sugar |
100.00 |
100.00 |
100.00 |
100.00 |
100.00 |
100.00 |
100.00 |
0 |
|
|
Fruits and Vegetables |
37.31 |
31.34 |
11.27 |
12.59 |
25.93 |
9.85 |
53.84 |
51 |
|
|
Oils |
54.33 |
54.46 |
63.59 |
63.11 |
57.75 |
32.11 |
78.91 |
23 |
|
|
Per Caput Calories from Imports (Cal/Cap/Day) |
905 |
1424 |
1973 |
1799 |
1435 |
607 |
2128 |
32 |
|
|
Aid + Commercial Food Import Bill (US$ 000) |
170,260 |
469,370 |
613,794 |
652,356 |
437,287 |
45,259 |
750,510 |
48 |
|
|
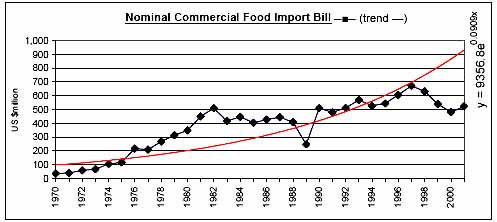
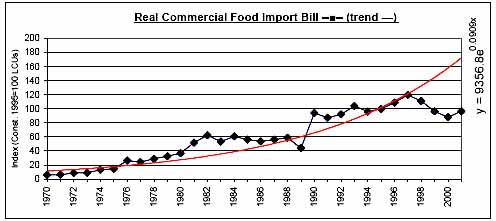
Commercial Food Import Bill (US$ 000) |
144,288 |
411,460 |
524,300 |
575,944 |
379,967 |
36,925 |
671,813 |
49 |
|
|
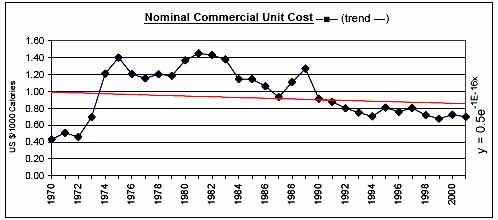
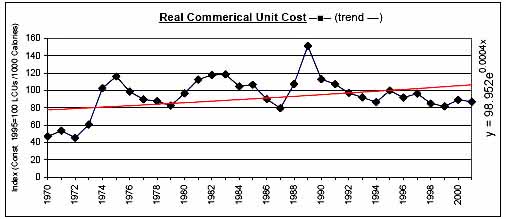
Commerical Unit Cost (US $/1000 calories) |
0.95 |
1.23 |
0.81 |
0.73 |
0.97 |
0.43 |
1.45 |
31 |
|
|
Commercial Food Import Bill / GDP (%) |
11.35 |
19.35 |
11.11 |
9.41 |
13.44 |
3.72 |
25.50 |
42 |
|
|
Comm. Fd. Imp. Bill / Total Merchandise Imp. Bill (%) |
19.07 |
14.96 |
16.83 |
13.83 |
16.38 |
10.51 |
22.13 |
18 |
|
|
Comm. Fd. Imp. Bill / Total Merchandise Exp. Bill (%) |
98.21 |
54.05 |
40.99 |
30.46 |
60.98 |
22.27 |
127.33 |
50 |
|
|
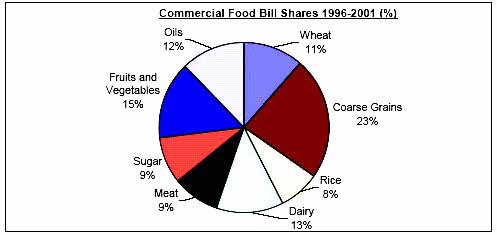
Commercial Food Value Bill Shares (%) |
Wheat |
11.71 |
15.80 |
14.03 |
11.43 |
13.37 |
4.39 |
21.17 |
34 |
|
Coarse Grains |
6.05 |
7.73 |
14.72 |
23.22 |
11.42 |
1.96 |
36.88 |
68 |
|
|
Rice |
5.40 |
3.40 |
6.00 |
7.84 |
5.35 |
0.00 |
12.55 |
56 |
|
|
Dairy |
9.13 |
13.60 |
15.02 |
12.89 |
12.33 |
6.73 |
19.60 |
27 |
|
|
Meat |
7.22 |
18.26 |
13.78 |
8.78 |
12.19 |
4.12 |
21.89 |
46 |
|
|
Sugar |
15.97 |
7.22 |
11.56 |
8.77 |
11.06 |
2.28 |
29.66 |
59 |
|
|
Fruits and Vegetables |
35.42 |
27.43 |
12.66 |
14.78 |
24.78 |
10.43 |
45.71 |
41 |
|
|
Oils |
9.10 |
6.56 |
12.24 |
12.29 |
9.49 |
3.99 |
18.70 |
41 |
|
|
|
|
|
|
|
|
|
|
![]()
![]()
![]()