![]()
![]()
![]()
|
Kenya |
Mean |
1970-2001 |
|||||||
|
1970-1979 |
1980-1989 |
1990-1995 |
1996-2001 |
Mean |
Min. |
Max. |
Variation (%) |
||
|
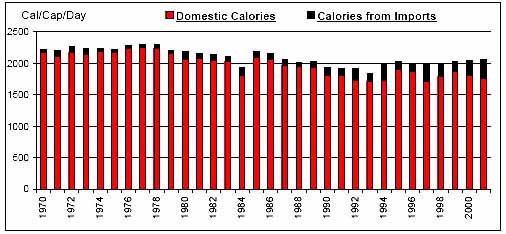
Per Caput Consumption (Cal/Day) |
2246 |
2100 |
1941 |
2017 |
2100 |
1845 |
2300 |
6 |
|
|
Imports / Consumption (%) |
Wheat |
17.73 |
33.78 |
58.56 |
69.09 |
40.03 |
0.78 |
76.26 |
57 |
|
Coarse Grains |
0.39 |
4.72 |
6.17 |
12.43 |
5.08 |
0.00 |
31.23 |
153 |
|
|
Rice |
5.49 |
32.06 |
48.94 |
55.90 |
31.39 |
0.00 |
74.40 |
79 |
|
|
Dairy |
0.98 |
3.15 |
0.72 |
0.64 |
1.54 |
0.03 |
8.25 |
137 |
|
|
Meat |
0.08 |
0.01 |
0.06 |
0.09 |
0.05 |
0.00 |
0.23 |
116 |
|
|
Sugar |
2.94 |
0.75 |
2.64 |
2.44 |
2.10 |
0.04 |
7.70 |
95 |
|
|
Fruits and Vegetables |
1.53 |
0.13 |
0.78 |
0.75 |
0.80 |
0.03 |
4.57 |
128 |
|
|
Oils |
28.92 |
45.96 |
55.90 |
57.76 |
44.71 |
18.35 |
67.89 |
29 |
|
|
Per Caput Calories from Imports (Cal/Cap/Day) |
63 |
100 |
162 |
216 |
122 |
37 |
296 |
57 |
|
|
Aid + Commercial Food Import Bill (US$ 000) |
49,237 |
125,795 |
250,547 |
399,114 |
176,509 |
25,025 |
492,626 |
81 |
|
|
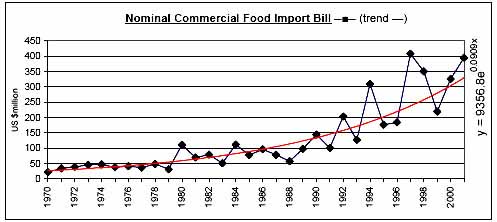
Commercial Food Import Bill (US$ 000) |
38,269 |
83,000 |
176,844 |
313,654 |
129,865 |
21,699 |
407,785 |
87 |
|
|
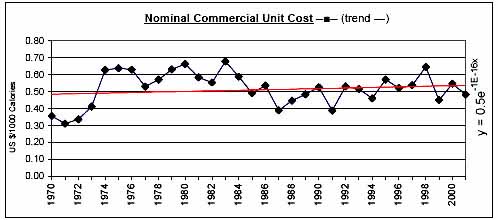
Commerical Unit Cost (US $/1000 calories) |
0.50 |
0.54 |
0.50 |
0.53 |
0.52 |
0.31 |
0.68 |
19 |
|
|
Commercial Food Import Bill / GDP (%) |
0.94 |
1.25 |
2.00 |
3.11 |
1.64 |
0.59 |
4.11 |
59 |
|
|
Comm. Fd. Imp. Bill / Total Merchandise Imp. Bill (%) |
4.61 |
4.63 |
8.42 |
9.52 |
6.25 |
1.90 |
14.92 |
49 |
|
|
Comm. Fd. Imp. Bill / Total Merchandise Exp. Bill (%) |
6.91 |
7.59 |
12.54 |
15.79 |
9.84 |
2.80 |
20.05 |
48 |
|
|
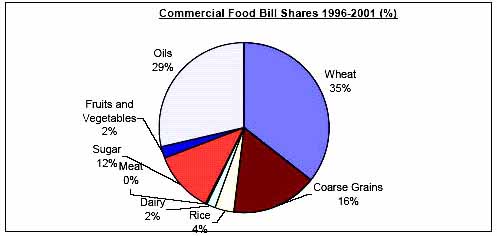
Commercial Food Value Bill Shares (%) |
Wheat |
10.22 |
6.48 |
21.84 |
35.60 |
15.99 |
0.00 |
49.31 |
91 |
|
Coarse Grains |
2.21 |
17.79 |
10.41 |
16.34 |
11.27 |
0.00 |
58.07 |
148 |
|
|
Rice |
0.71 |
7.09 |
1.17 |
3.73 |
3.36 |
0.00 |
17.25 |
137 |
|
|
Dairy |
2.80 |
6.69 |
2.28 |
1.62 |
3.70 |
0.13 |
20.63 |
115 |
|
|
Meat |
0.48 |
0.05 |
0.12 |
0.19 |
0.22 |
0.00 |
1.44 |
139 |
|
|
Sugar |
33.11 |
9.59 |
22.87 |
11.61 |
19.81 |
0.47 |
52.23 |
76 |
|
|
Fruits and Vegetables |
9.64 |
4.41 |
3.81 |
2.37 |
5.55 |
0.85 |
17.27 |
68 |
|
|
Oils |
40.83 |
47.90 |
37.50 |
28.54 |
40.11 |
20.58 |
80.01 |
38 |
|
|
|
|
|
|
|
|
|
|
![]()
![]()
![]()