![]()
![]()
![]()
|
Kiribati |
Mean |
1970-2001 |
|||||||
|
1970-1979 |
1980-1989 |
1990-1995 |
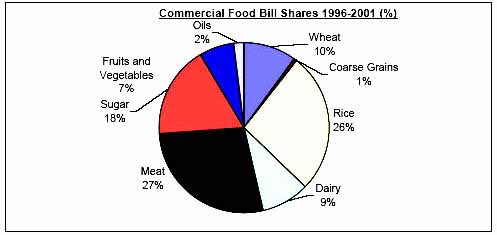
1996-2001 |
Mean |
Min. |
Max. |
Variation (%) |
||
|
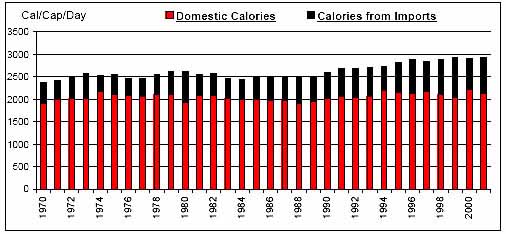
Per Caput Consumption (Cal/Day) |
2503 |
2512 |
2701 |
2896 |
2617 |
2376 |
2922 |
6 |
|
|
Imports / Consumption (%) |
Wheat |
100.00 |
100.00 |
100.00 |
100.00 |
100.00 |
100.00 |
100.00 |
0 |
|
Coarse Grains |
100.00 |
N/A |
100.00 |
100.00 |
100.00 |
100.00 |
100.00 |
0 |
|
|
Rice |
100.00 |
100.00 |
100.00 |
100.00 |
100.00 |
100.00 |
100.00 |
0 |
|
|
Dairy |
100.00 |
100.00 |
100.00 |
100.00 |
100.00 |
100.00 |
100.00 |
0 |
|
|
Meat |
40.61 |
39.07 |
45.39 |
58.05 |
44.29 |
32.00 |
60.49 |
20 |
|
|
Sugar |
100.00 |
100.00 |
100.00 |
100.00 |
100.00 |
100.00 |
100.00 |
0 |
|
|
Fruits and Vegetables |
4.49 |
3.02 |
4.54 |
5.23 |
4.18 |
2.28 |
8.24 |
33 |
|
|
Oils |
0.08 |
0.13 |
0.24 |
0.22 |
0.15 |
0.00 |
0.36 |
56 |
|
|
Per Caput Calories from Imports (Cal/Cap/Day) |
447 |
522 |
616 |
766 |
562 |
369 |
893 |
24 |
|
|
Aid + Commercial Food Import Bill (US$ 000) |
2,533 |
4,235 |
6,905 |
8,030 |
4,915 |
1,053 |
10,584 |
49 |
|
|
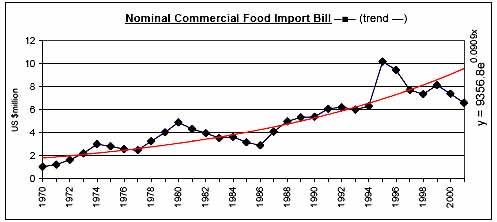
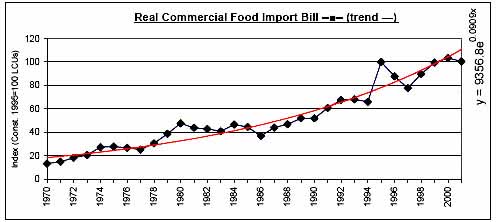
Commercial Food Import Bill (US$ 000) |
2,436 |
4,092 |
6,702 |
7,781 |
4,756 |
1,053 |
10,187 |
49 |
|
|
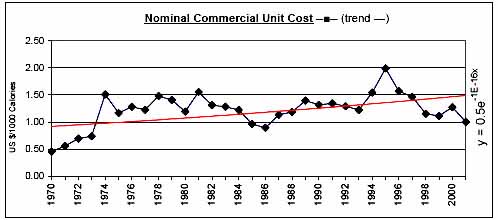
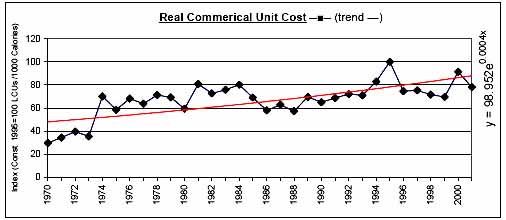
Commerical Unit Cost (US $/1000 calories) |
1.05 |
1.21 |
1.45 |
1.26 |
1.22 |
0.46 |
1.99 |
26 |
|
|
Commercial Food Import Bill / GDP (%) |
4.18 |
12.64 |
19.09 |
18.56 |
12.32 |
1.81 |
26.89 |
54 |
|
|
Comm. Fd. Imp. Bill / Total Merchandise Imp. Bill (%) |
22.83 |
20.77 |
22.45 |
21.32 |
21.83 |
16.52 |
28.88 |
14 |
|
|
Comm. Fd. Imp. Bill / Total Merchandise Exp. Bill (%) |
13.03 |
122.08 |
160.22 |
126.97 |
96.07 |
7.80 |
211.35 |
70 |
|
|
Commercial Food Value Bill Shares (%) |
Wheat |
15.56 |
15.46 |
11.36 |
9.91 |
13.68 |
6.52 |
21.37 |
29 |
|
Coarse Grains |
0.12 |
N/A |
0.08 |
0.61 |
0.17 |
0.00 |
1.10 |
179 |
|
|
Rice |
22.58 |
29.41 |
31.43 |
26.57 |
27.12 |
15.32 |
36.68 |
17 |
|
|
Dairy |
8.06 |
8.22 |
9.53 |
9.34 |
8.63 |
5.42 |
10.88 |
13 |
|
|
Meat |
29.54 |
25.43 |
25.98 |
27.38 |
27.18 |
13.91 |
35.61 |
18 |
|
|
Sugar |
16.71 |
14.39 |
12.98 |
17.55 |
15.45 |
11.73 |
25.84 |
23 |
|
|
Fruits and Vegetables |
6.24 |
5.55 |
6.88 |
6.79 |
6.25 |
4.45 |
8.86 |
18 |
|
|
Oils |
1.17 |
1.54 |
1.75 |
1.85 |
1.52 |
0.00 |
2.42 |
39 |
|
|
|
|
|
|
|
|
|
|
![]()
![]()
![]()