![]()
![]()
![]()
|
Lao People's Dem. Rep. |
Mean |
1970-2001 |
|||||||
|
1970-1979 |
1980-1989 |
1990-1995 |
1996-2001 |
Mean |
Min. |
Max. |
Variation (%) |
||
|
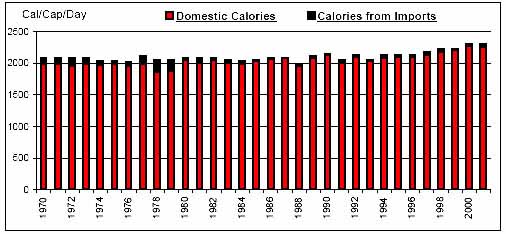
Per Caput Consumption (Cal/Day) |
2066 |
2067 |
2108 |
2231 |
2105 |
1967 |
2309 |
4 |
|
|
Imports / Consumption (%) |
Wheat |
100.00 |
100.00 |
100.00 |
100.00 |
100.00 |
100.00 |
100.00 |
0 |
|
Coarse Grains |
0.12 |
0.56 |
0.34 |
0.31 |
0.33 |
0.00 |
2.87 |
217 |
|
|
Rice |
8.50 |
1.27 |
0.91 |
1.20 |
3.45 |
0.09 |
15.72 |
120 |
|
|
Dairy |
41.19 |
19.01 |
63.32 |
74.84 |
44.72 |
0.00 |
84.21 |
72 |
|
|
Meat |
2.21 |
0.45 |
0.45 |
0.01 |
0.92 |
0.00 |
6.18 |
181 |
|
|
Sugar |
24.51 |
6.74 |
14.37 |
13.58 |
15.01 |
1.61 |
45.60 |
64 |
|
|
Fruits and Vegetables |
0.44 |
0.01 |
0.59 |
1.01 |
0.44 |
0.00 |
1.86 |
129 |
|
|
Oils |
1.15 |
N/A |
0.09 |
0.43 |
0.46 |
0.00 |
4.82 |
214 |
|
|
Per Caput Calories from Imports (Cal/Cap/Day) |
106 |
30 |
27 |
40 |
55 |
6 |
190 |
82 |
|
|
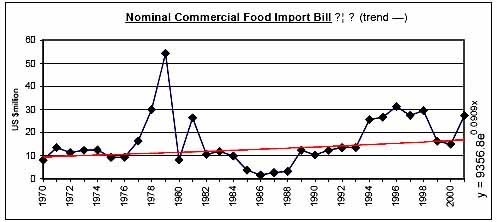
Aid + Commercial Food Import Bill (US$ 000) |
22,562 |
9,940 |
17,510 |
24,784 |
18,087 |
1,650 |
56,590 |
73 |
|
|
Commercial Food Import Bill (US$ 000) |
17,642 |
8,992 |
16,961 |
24,467 |
16,091 |
1,650 |
54,384 |
69 |
|
|
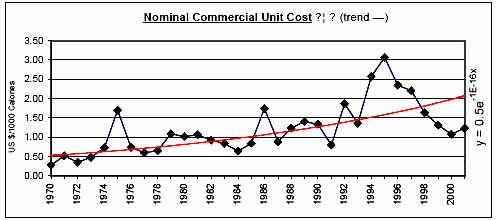
Commerical Unit Cost (US $/1000 calories) |
0.71 |
1.06 |
1.83 |
1.63 |
1.20 |
0.28 |
3.06 |
55 |
|
|
Commercial Food Import Bill / GDP (%) |
3.90 |
1.37 |
1.58 |
1.66 |
2.25 |
0.21 |
11.43 |
92 |
|
|
Comm. Fd. Imp. Bill / Total Merchandise Imp. Bill (%) |
27.96 |
6.67 |
4.87 |
4.17 |
12.52 |
0.89 |
77.69 |
122 |
|
|
Comm. Fd. Imp. Bill / Total Merchandise Exp. Bill (%) |
190.42 |
25.75 |
8.23 |
7.55 |
70.51 |
3.00 |
316.91 |
138 |
|
|
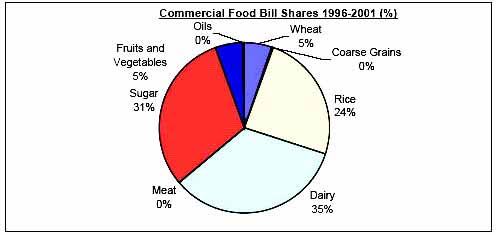
Commercial Food Value Bill Shares (%) |
Wheat |
3.13 |
22.98 |
8.92 |
5.22 |
10.81 |
0.00 |
71.17 |
128 |
|
Coarse Grains |
0.04 |
1.40 |
0.16 |
0.34 |
0.54 |
0.00 |
8.25 |
321 |
|
|
Rice |
74.30 |
38.09 |
19.60 |
24.36 |
43.36 |
5.19 |
90.62 |
66 |
|
|
Dairy |
4.81 |
6.17 |
29.26 |
33.91 |
15.27 |
0.00 |
42.49 |
95 |
|
|
Meat |
7.16 |
3.37 |
1.95 |
0.03 |
3.66 |
0.00 |
22.22 |
187 |
|
|
Sugar |
7.77 |
27.91 |
37.29 |
30.47 |
23.85 |
2.70 |
71.99 |
79 |
|
|
Fruits and Vegetables |
2.20 |
0.09 |
2.77 |
5.26 |
2.22 |
0.00 |
7.39 |
114 |
|
|
Oils |
0.59 |
N/A |
0.06 |
0.41 |
0.27 |
0.00 |
2.06 |
178 |
|
|
|
|
|
|
|
|
|
|
![]()
![]()
![]()