![]()
![]()
![]()
|
Lesotho |
Mean |
1970-2001 |
|||||||
|
1970-1979 |
1980-1989 |
1990-1995 |
1996-2001 |
Mean |
Min. |
Max. |
Variation (%) |
||
|
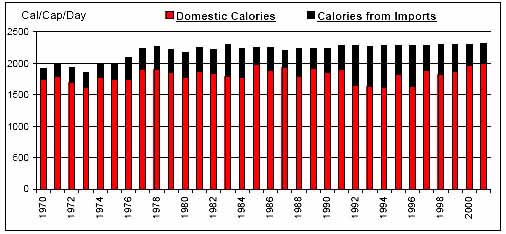
Per Caput Consumption (Cal/Day) |
2050 |
2234 |
2273 |
2296 |
2195 |
1860 |
2320 |
6 |
|
|
Imports / Consumption (%) |
Wheat |
52.86 |
75.64 |
86.07 |
65.70 |
68.61 |
32.94 |
92.19 |
24 |
|
Coarse Grains |
8.01 |
23.37 |
49.47 |
40.48 |
26.67 |
1.59 |
68.51 |
68 |
|
|
Rice |
100.00 |
100.00 |
100.00 |
100.00 |
100.00 |
100.00 |
100.00 |
0 |
|
|
Dairy |
38.39 |
52.48 |
17.49 |
17.88 |
35.03 |
11.27 |
72.82 |
54 |
|
|
Meat |
0.05 |
12.61 |
17.77 |
19.71 |
10.98 |
0.00 |
20.36 |
80 |
|
|
Sugar |
100.00 |
100.00 |
100.00 |
100.00 |
100.00 |
100.00 |
100.00 |
0 |
|
|
Fruits and Vegetables |
25.71 |
43.63 |
57.30 |
60.49 |
43.75 |
16.47 |
62.63 |
35 |
|
|
Oils |
98.20 |
98.03 |
98.78 |
98.78 |
98.36 |
91.81 |
100.00 |
2 |
|
|
Per Caput Calories from Imports (Cal/Cap/Day) |
272 |
375 |
529 |
436 |
383 |
179 |
664 |
34 |
|
|
Aid + Commercial Food Import Bill (US$ 000) |
18,961 |
61,393 |
80,703 |
90,138 |
57,143 |
3,925 |
103,005 |
53 |
|
|
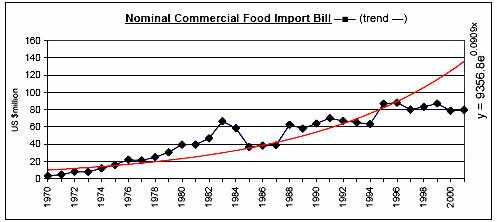
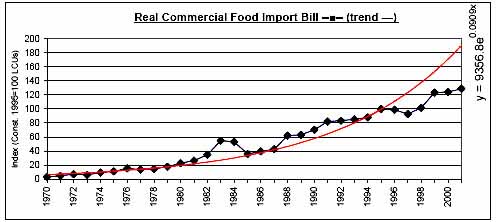
Commercial Food Import Bill (US$ 000) |
15,286 |
48,668 |
69,540 |
83,010 |
48,589 |
3,651 |
88,255 |
56 |
|
|
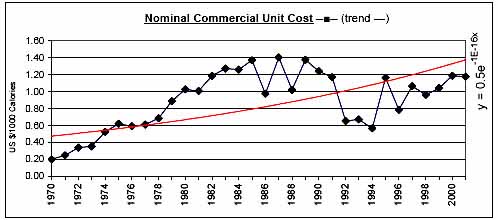
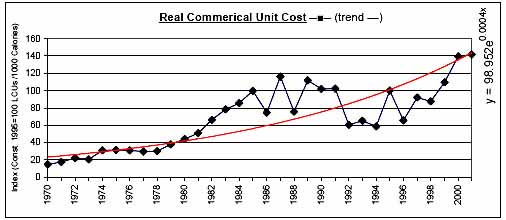
Commerical Unit Cost (US $/1000 calories) |
0.51 |
1.19 |
0.91 |
1.04 |
0.90 |
0.20 |
1.41 |
39 |
|
|
Commercial Food Import Bill / GDP (%) |
3.43 |
9.46 |
8.94 |
8.35 |
7.27 |
0.94 |
14.52 |
44 |
|
|
Comm. Fd. Imp. Bill / Total Merchandise Imp. Bill (%) |
10.62 |
10.01 |
7.59 |
9.76 |
9.70 |
6.63 |
14.72 |
20 |
|
|
Comm. Fd. Imp. Bill / Total Merchandise Exp. Bill (%) |
90.68 |
126.74 |
70.06 |
39.10 |
88.41 |
28.55 |
214.10 |
54 |
|
|
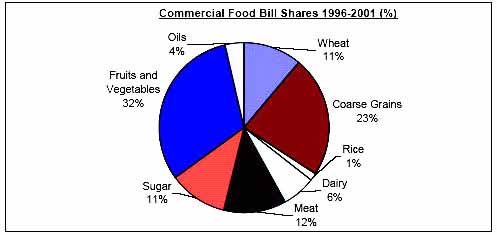
Commercial Food Value Bill Shares (%) |
Wheat |
31.34 |
16.11 |
13.99 |
11.04 |
19.52 |
5.77 |
38.70 |
50 |
|
Coarse Grains |
0.93 |
8.37 |
11.98 |
23.20 |
9.50 |
0.00 |
26.33 |
93 |
|
|
Rice |
0.64 |
1.00 |
0.15 |
1.44 |
0.81 |
0.00 |
2.78 |
93 |
|
|
Dairy |
13.84 |
13.88 |
7.08 |
6.21 |
11.15 |
2.38 |
31.03 |
53 |
|
|
Meat |
0.17 |
11.25 |
13.34 |
12.07 |
8.33 |
0.00 |
18.70 |
79 |
|
|
Sugar |
22.83 |
18.24 |
13.06 |
11.10 |
17.37 |
10.42 |
26.51 |
31 |
|
|
Fruits and Vegetables |
24.77 |
28.17 |
36.39 |
31.22 |
29.22 |
17.63 |
41.91 |
23 |
|
|
Oils |
5.48 |
2.98 |
4.01 |
3.71 |
4.09 |
0.00 |
8.82 |
49 |
|
|
|
|
|
|
|
|
|
|
![]()
![]()
![]()