![]()
![]()
![]()
|
Liberia |
Mean |
1970-2001 |
|||||||
|
1970-1979 |
1980-1989 |
1990-1995 |
1996-2001 |
Mean |
Min. |
Max. |
Variation (%) |
||
|
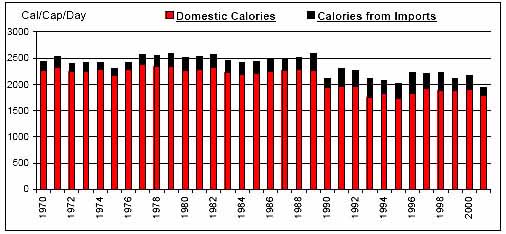
Per Caput Consumption (Cal/Day) |
2463 |
2500 |
2145 |
2148 |
2356 |
1946 |
2591 |
8 |
|
|
Imports / Consumption (%) |
Wheat |
100.00 |
100.00 |
100.00 |
100.00 |
100.00 |
100.00 |
100.00 |
0 |
|
Coarse Grains |
100.00 |
100.00 |
100.00 |
100.00 |
100.00 |
100.00 |
100.00 |
0 |
|
|
Rice |
17.35 |
24.70 |
51.55 |
16.95 |
25.98 |
7.22 |
66.67 |
58 |
|
|
Dairy |
93.94 |
94.93 |
86.56 |
87.42 |
91.64 |
81.54 |
96.87 |
5 |
|
|
Meat |
13.18 |
23.61 |
16.37 |
20.44 |
18.40 |
9.23 |
29.43 |
32 |
|
|
Sugar |
7.99 |
4.17 |
2.50 |
3.12 |
4.85 |
1.90 |
12.59 |
61 |
|
|
Fruits and Vegetables |
3.23 |
3.57 |
3.77 |
5.12 |
3.79 |
2.40 |
6.23 |
23 |
|
|
Oils |
5.85 |
11.45 |
10.31 |
11.67 |
9.53 |
3.65 |
16.66 |
40 |
|
|
Per Caput Calories from Imports (Cal/Cap/Day) |
177 |
246 |
285 |
278 |
238 |
120 |
395 |
28 |
|
|
Aid + Commercial Food Import Bill (US$ 000) |
30,561 |
65,843 |
63,782 |
49,637 |
51,392 |
16,209 |
80,625 |
36 |
|
|
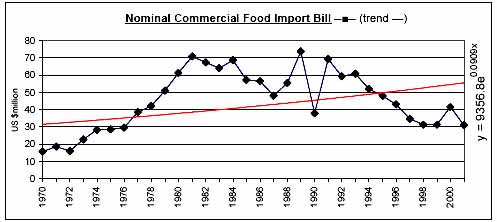
Commercial Food Import Bill (US$ 000) |
29,204 |
62,410 |
54,672 |
35,556 |
45,547 |
15,792 |
73,825 |
38 |
|
|
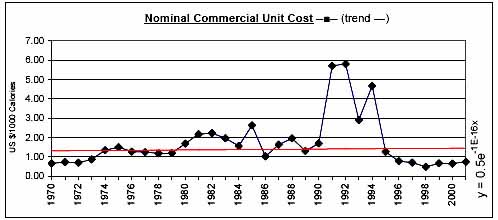
Commerical Unit Cost (US $/1000 calories) |
1.07 |
1.82 |
3.68 |
0.67 |
1.72 |
0.48 |
5.80 |
79 |
|
|
Commercial Food Import Bill / GDP (%) |
2.17 |
4.64 |
4.61 |
3.04 |
3.56 |
1.26 |
5.83 |
37 |
|
|
Comm. Fd. Imp. Bill / Total Merchandise Imp. Bill (%) |
9.60 |
17.75 |
19.04 |
8.87 |
13.78 |
7.45 |
26.78 |
39 |
|
|
Comm. Fd. Imp. Bill / Total Merchandise Exp. Bill (%) |
7.50 |
13.77 |
16.02 |
7.08 |
10.98 |
5.97 |
20.40 |
39 |
|
|
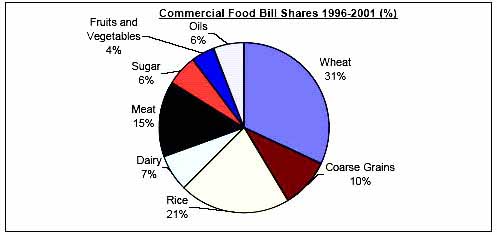
Commercial Food Value Bill Shares (%) |
Wheat |
6.96 |
6.39 |
8.99 |
31.91 |
11.84 |
0.61 |
54.63 |
114 |
|
Coarse Grains |
0.31 |
0.25 |
1.58 |
9.54 |
2.26 |
0.00 |
17.53 |
200 |
|
|
Rice |
52.08 |
59.59 |
70.72 |
21.10 |
52.11 |
10.53 |
90.82 |
36 |
|
|
Dairy |
8.87 |
7.91 |
3.98 |
6.88 |
7.28 |
2.63 |
11.05 |
31 |
|
|
Meat |
9.39 |
9.01 |
6.69 |
14.58 |
9.74 |
4.24 |
21.06 |
37 |
|
|
Sugar |
8.21 |
4.93 |
4.34 |
5.69 |
5.99 |
1.63 |
12.72 |
41 |
|
|
Fruits and Vegetables |
9.93 |
6.75 |
2.49 |
4.47 |
6.52 |
0.00 |
12.40 |
57 |
|
|
Oils |
4.25 |
5.16 |
1.22 |
5.83 |
4.27 |
0.00 |
10.92 |
65 |
|
|
|
|
|
|
|
|
|
|
![]()
![]()
![]()