![]()
![]()
![]()
|
Madagascar |
Mean |
1970-2001 |
|||||||
|
1970-1979 |
1980-1989 |
1990-1995 |
1996-2001 |
Mean |
Min. |
Max. |
Variation (%) |
||
|
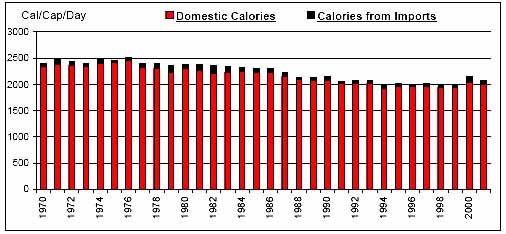
Per Caput Consumption (Cal/Day) |
2429 |
2286 |
2056 |
2038 |
2241 |
1991 |
2514 |
8 |
|
|
Imports / Consumption (%) |
Wheat |
99.65 |
98.18 |
89.20 |
91.21 |
95.65 |
85.32 |
100.00 |
5 |
|
Coarse Grains |
0.15 |
1.34 |
4.66 |
0.40 |
1.42 |
0.00 |
15.80 |
238 |
|
|
Rice |
3.85 |
6.72 |
1.96 |
3.71 |
4.37 |
0.60 |
15.25 |
72 |
|
|
Dairy |
6.30 |
4.62 |
3.08 |
2.70 |
4.50 |
1.19 |
8.65 |
43 |
|
|
Meat |
0.16 |
0.05 |
0.06 |
0.03 |
0.09 |
0.00 |
0.36 |
124 |
|
|
Sugar |
0.00 |
0.24 |
0.40 |
1.21 |
0.38 |
0.00 |
1.93 |
145 |
|
|
Fruits and Vegetables |
0.06 |
0.01 |
0.11 |
0.08 |
0.06 |
0.00 |
0.33 |
121 |
|
|
Oils |
16.01 |
10.31 |
16.24 |
17.91 |
14.63 |
7.18 |
25.47 |
30 |
|
|
Per Caput Calories from Imports (Cal/Cap/Day) |
76 |
88 |
57 |
68 |
75 |
38 |
162 |
38 |
|
|
Aid + Commercial Food Import Bill (US$ 000) |
42,352 |
67,031 |
53,799 |
70,713 |
57,528 |
12,857 |
123,818 |
44 |
|
|
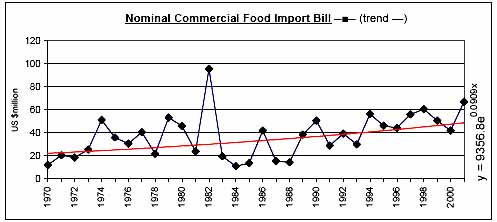
Commercial Food Import Bill (US$ 000) |
30,989 |
32,005 |
41,887 |
53,374 |
37,547 |
11,019 |
95,656 |
51 |
|
|
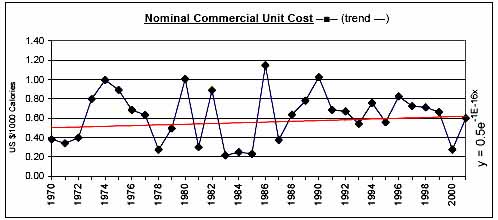
Commerical Unit Cost (US $/1000 calories) |
0.59 |
0.58 |
0.71 |
0.63 |
0.62 |
0.21 |
1.15 |
42 |
|
|
Commercial Food Import Bill / GDP (%) |
1.12 |
1.16 |
1.39 |
1.55 |
1.27 |
0.41 |
3.67 |
50 |
|
|
Comm. Fd. Imp. Bill / Total Merchandise Imp. Bill (%) |
10.12 |
7.89 |
8.42 |
9.52 |
8.99 |
2.95 |
22.26 |
46 |
|
|
Comm. Fd. Imp. Bill / Total Merchandise Exp. Bill (%) |
12.16 |
9.99 |
12.84 |
16.62 |
12.45 |
3.27 |
30.53 |
51 |
|
|
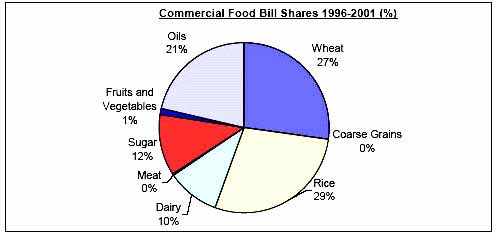
Commercial Food Value Bill Shares (%) |
Wheat |
16.49 |
12.79 |
22.54 |
27.20 |
18.48 |
0.00 |
62.77 |
80 |
|
Coarse Grains |
0.02 |
3.36 |
1.69 |
0.01 |
1.38 |
0.00 |
16.25 |
267 |
|
|
Rice |
40.99 |
31.78 |
32.33 |
28.47 |
34.14 |
0.00 |
86.25 |
73 |
|
|
Dairy |
19.33 |
20.90 |
12.43 |
9.78 |
16.74 |
4.40 |
55.28 |
64 |
|
|
Meat |
1.58 |
0.99 |
0.41 |
0.34 |
0.94 |
0.00 |
4.76 |
126 |
|
|
Sugar |
0.08 |
4.70 |
5.68 |
11.70 |
4.75 |
0.00 |
19.28 |
138 |
|
|
Fruits and Vegetables |
2.30 |
0.66 |
1.59 |
1.06 |
1.42 |
0.08 |
6.92 |
99 |
|
|
Oils |
19.21 |
24.82 |
23.33 |
21.43 |
22.15 |
0.00 |
54.52 |
51 |
|
|
|
|
|
|
|
|
|
|
![]()
![]()
![]()