![]()
![]()
![]()
|
Malawi |
Mean |
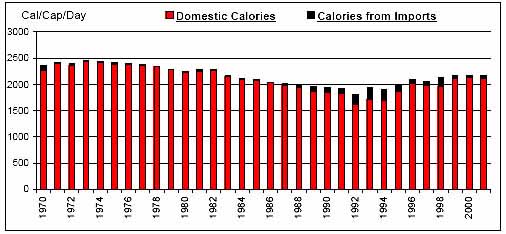
1970-2001 |
|||||||
|
1970-1979 |
1980-1989 |
1990-1995 |
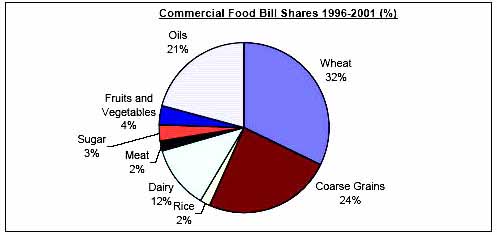
1996-2001 |
Mean |
Min. |
Max. |
Variation (%) |
||
|
Per Caput Consumption (Cal/Day) |
2388 |
2117 |
1915 |
2126 |
2166 |
1798 |
2452 |
9 |
|
|
Imports / Consumption (%) |
Wheat |
96.41 |
94.05 |
97.58 |
97.74 |
96.14 |
86.91 |
99.26 |
3 |
|
Coarse Grains |
1.32 |
2.53 |
18.96 |
4.97 |
5.69 |
0.00 |
34.73 |
151 |
|
|
Rice |
0.39 |
2.48 |
6.13 |
2.14 |
2.45 |
0.00 |
14.78 |
158 |
|
|
Dairy |
29.50 |
31.85 |
29.48 |
23.45 |
29.10 |
13.55 |
39.51 |
26 |
|
|
Meat |
1.51 |
0.26 |
0.60 |
0.74 |
0.80 |
0.02 |
3.36 |
101 |
|
|
Sugar |
0.49 |
0.00 |
0.10 |
0.28 |
0.22 |
0.00 |
1.82 |
181 |
|
|
Fruits and Vegetables |
0.25 |
0.09 |
1.20 |
0.31 |
0.39 |
0.03 |
2.91 |
170 |
|
|
Oils |
0.87 |
2.07 |
23.09 |
11.43 |
7.39 |
0.47 |
30.52 |
126 |
|
|
Per Caput Calories from Imports (Cal/Cap/Day) |
31 |
32 |
153 |
76 |
63 |
10 |
227 |
94 |
|
|
Aid + Commercial Food Import Bill (US$ 000) |
11,423 |
25,704 |
111,852 |
55,521 |
42,984 |
7,318 |
151,668 |
101 |
|
|
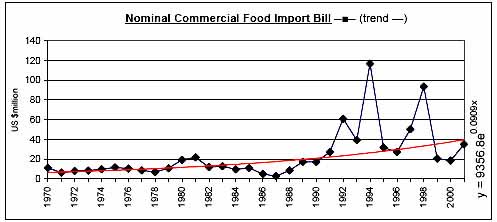
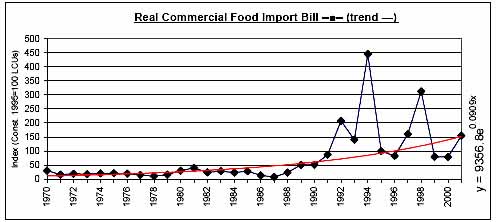
Commercial Food Import Bill (US$ 000) |
9,216 |
11,993 |
48,809 |
40,868 |
23,442 |
2,853 |
116,743 |
108 |
|
|
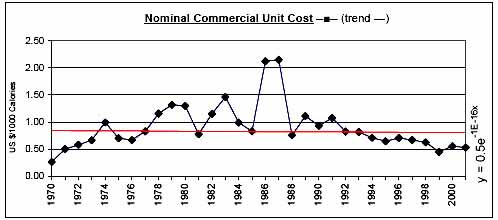
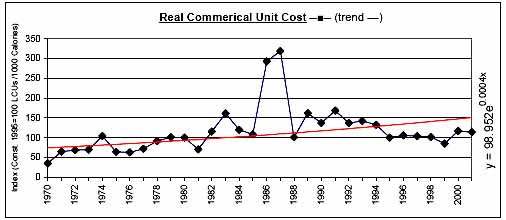
Commerical Unit Cost (US $/1000 calories) |
0.77 |
1.27 |
0.83 |
0.59 |
0.90 |
0.26 |
2.15 |
47 |
|
|
Commercial Food Import Bill / GDP (%) |
0.88 |
0.84 |
2.78 |
1.80 |
1.40 |
0.19 |
6.93 |
94 |
|
|
Comm. Fd. Imp. Bill / Total Merchandise Imp. Bill (%) |
5.27 |
3.42 |
7.93 |
6.74 |
5.47 |
0.96 |
19.14 |
70 |
|
|
Comm. Fd. Imp. Bill / Total Merchandise Exp. Bill (%) |
8.17 |
4.45 |
12.46 |
7.50 |
7.69 |
0.97 |
30.63 |
74 |
|
|
Commercial Food Value Bill Shares (%) |
Wheat |
33.80 |
30.55 |
28.38 |
32.35 |
31.50 |
0.00 |
54.06 |
50 |
|
Coarse Grains |
11.34 |
7.41 |
25.00 |
24.36 |
15.12 |
0.00 |
70.47 |
141 |
|
|
Rice |
0.59 |
5.50 |
3.65 |
1.96 |
2.96 |
0.03 |
35.05 |
214 |
|
|
Dairy |
27.88 |
37.97 |
15.04 |
11.75 |
25.60 |
3.13 |
74.92 |
57 |
|
|
Meat |
4.01 |
1.47 |
1.41 |
2.04 |
2.36 |
0.14 |
7.00 |
73 |
|
|
Sugar |
5.47 |
0.12 |
0.48 |
3.06 |
2.41 |
0.00 |
14.74 |
161 |
|
|
Fruits and Vegetables |
7.47 |
3.38 |
5.33 |
3.75 |
5.10 |
0.00 |
13.42 |
70 |
|
|
Oils |
9.43 |
13.60 |
20.70 |
20.72 |
14.96 |
3.68 |
45.18 |
71 |
|
|
|
|
|
|
|
|
|
|
![]()
![]()
![]()