![]()
![]()
![]()
|
Maldives |
Mean |
1970-2001 |
|||||||
|
1970-1979 |
1980-1989 |
1990-1995 |
1996-2001 |
Mean |
Min. |
Max. |
Variation (%) |
||
|
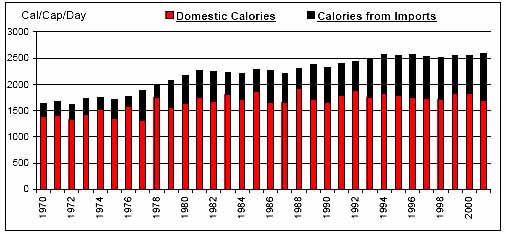
Per Caput Consumption (Cal/Day) |
1780 |
2250 |
2460 |
2548 |
2198 |
1616 |
2587 |
15 |
|
|
Imports / Consumption (%) |
Wheat |
100.00 |
100.00 |
100.00 |
100.00 |
100.00 |
100.00 |
100.00 |
0 |
|
Coarse Grains |
N/A |
6.33 |
52.43 |
79.80 |
26.77 |
0.00 |
94.12 |
142 |
|
|
Rice |
100.00 |
100.00 |
100.00 |
100.00 |
100.00 |
100.00 |
100.00 |
0 |
|
|
Dairy |
N/A |
100.00 |
100.00 |
100.00 |
100.00 |
100.00 |
100.00 |
0 |
|
|
Meat |
N/A |
10.02 |
57.59 |
68.89 |
26.85 |
0.00 |
77.10 |
118 |
|
|
Sugar |
100.00 |
100.00 |
100.00 |
100.00 |
100.00 |
100.00 |
100.00 |
0 |
|
|
Fruits and Vegetables |
4.85 |
11.45 |
21.01 |
31.50 |
14.94 |
0.29 |
38.17 |
75 |
|
|
Oils |
N/A |
0.62 |
10.32 |
21.11 |
6.09 |
0.00 |
28.90 |
151 |
|
|
Per Caput Calories from Imports (Cal/Cap/Day) |
320 |
515 |
679 |
789 |
536 |
200 |
889 |
37 |
|
|
Aid + Commercial Food Import Bill (US$ 000) |
2,505 |
9,661 |
26,566 |
47,935 |
17,771 |
935 |
57,740 |
102 |
|
|
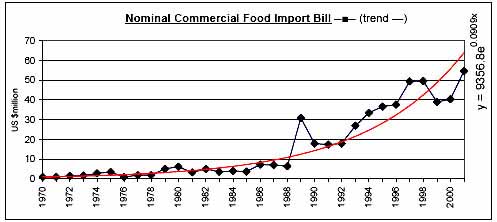
Commercial Food Import Bill (US$ 000) |
2,108 |
7,734 |
25,034 |
45,124 |
16,230 |
915 |
54,593 |
107 |
|
|
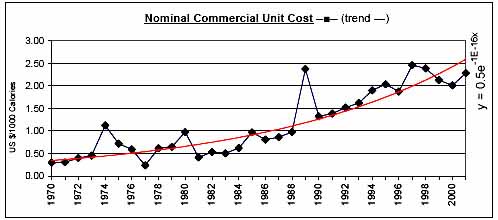
Commerical Unit Cost (US $/1000 calories) |
0.54 |
0.91 |
1.63 |
2.19 |
1.17 |
0.24 |
2.46 |
62 |
|
|
Commercial Food Import Bill / GDP (%) |
3.47 |
6.09 |
10.34 |
12.45 |
7.26 |
1.54 |
17.93 |
63 |
|
|
Comm. Fd. Imp. Bill / Total Merchandise Imp. Bill (%) |
29.94 |
12.27 |
12.66 |
12.44 |
17.90 |
6.07 |
50.85 |
63 |
|
|
Comm. Fd. Imp. Bill / Total Merchandise Exp. Bill (%) |
59.37 |
37.17 |
55.61 |
64.07 |
52.61 |
15.97 |
135.24 |
51 |
|
|
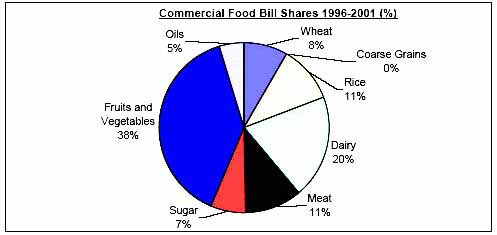
Commercial Food Value Bill Shares (%) |
Wheat |
18.32 |
16.67 |
9.56 |
8.20 |
14.26 |
0.00 |
49.92 |
70 |
|
Coarse Grains |
N/A |
0.01 |
0.09 |
0.09 |
0.04 |
0.00 |
0.20 |
157 |
|
|
Rice |
24.64 |
21.36 |
12.74 |
10.91 |
18.81 |
0.00 |
48.47 |
68 |
|
|
Dairy |
N/A |
6.36 |
18.51 |
19.65 |
9.14 |
0.00 |
22.41 |
104 |
|
|
Meat |
N/A |
2.65 |
14.14 |
10.86 |
5.52 |
0.00 |
20.62 |
119 |
|
|
Sugar |
33.27 |
32.08 |
15.99 |
6.61 |
24.66 |
2.82 |
59.91 |
61 |
|
|
Fruits and Vegetables |
23.76 |
20.66 |
25.83 |
39.08 |
26.05 |
10.10 |
53.69 |
41 |
|
|
Oils |
N/A |
0.20 |
3.14 |
4.61 |
1.52 |
0.00 |
6.12 |
140 |
|
|
|
|
|
|
|
|
|
|
![]()
![]()
![]()