![]()
![]()
![]()
|
Mali |
Mean |
1970-2001 |
|||||||
|
1970-1979 |
1980-1989 |
1990-1995 |
1996-2001 |
Mean |
Min. |
Max. |
Variation (%) |
||
|
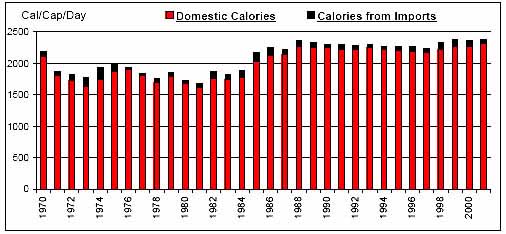
Per Caput Consumption (Cal/Day) |
1897 |
2032 |
2288 |
2324 |
2093 |
1679 |
2379 |
11 |
|
|
Imports / Consumption (%) |
Wheat |
92.29 |
96.77 |
93.40 |
91.08 |
93.67 |
86.45 |
98.59 |
4 |
|
Coarse Grains |
6.42 |
2.47 |
0.70 |
0.06 |
2.92 |
0.00 |
14.56 |
128 |
|
|
Rice |
11.66 |
26.89 |
6.05 |
7.87 |
14.66 |
0.05 |
47.82 |
81 |
|
|
Dairy |
5.64 |
6.78 |
10.92 |
11.86 |
8.15 |
0.85 |
14.52 |
48 |
|
|
Meat |
0.05 |
0.30 |
0.20 |
0.07 |
0.16 |
0.01 |
0.89 |
124 |
|
|
Sugar |
23.42 |
13.01 |
16.65 |
23.83 |
18.97 |
2.88 |
37.58 |
52 |
|
|
Fruits and Vegetables |
10.15 |
5.48 |
5.43 |
4.86 |
6.82 |
2.16 |
14.67 |
47 |
|
|
Oils |
1.26 |
0.69 |
0.95 |
2.11 |
1.18 |
0.04 |
8.43 |
131 |
|
|
Per Caput Calories from Imports (Cal/Cap/Day) |
91 |
94 |
62 |
86 |
85 |
36 |
191 |
40 |
|
|
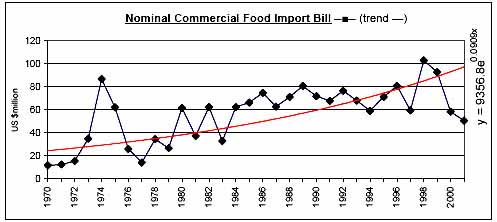
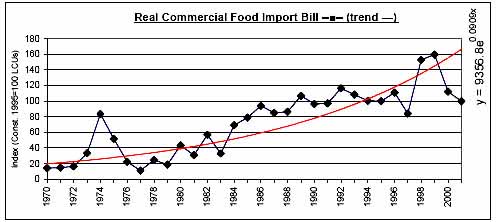
Aid + Commercial Food Import Bill (US$ 000) |
40,069 |
71,798 |
73,603 |
76,446 |
63,092 |
13,924 |
105,809 |
39 |
|
|
Commercial Food Import Bill (US$ 000) |
32,456 |
61,251 |
69,090 |
74,183 |
56,147 |
11,678 |
102,889 |
44 |
|
|
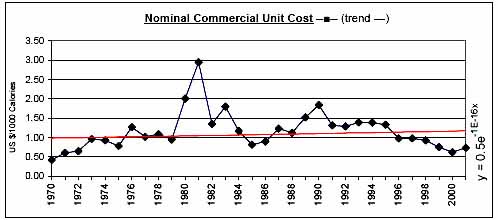
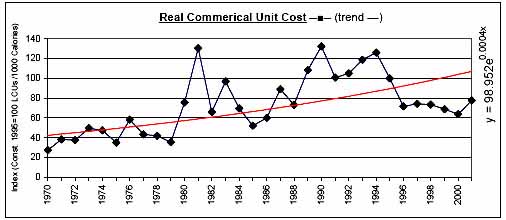
Commerical Unit Cost (US $/1000 calories) |
0.87 |
1.49 |
1.43 |
0.83 |
1.16 |
0.42 |
2.95 |
43 |
|
|
Commercial Food Import Bill / GDP (%) |
1.79 |
2.94 |
2.64 |
2.22 |
2.39 |
0.65 |
4.79 |
41 |
|
|
Comm. Fd. Imp. Bill / Total Merchandise Imp. Bill (%) |
22.85 |
13.65 |
10.30 |
9.27 |
15.07 |
6.02 |
48.22 |
60 |
|
|
Comm. Fd. Imp. Bill / Total Merchandise Exp. Bill (%) |
36.05 |
26.16 |
19.09 |
13.15 |
25.49 |
6.85 |
104.57 |
74 |
|
|
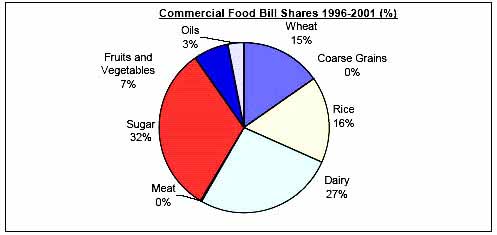
Commercial Food Value Bill Shares (%) |
Wheat |
10.03 |
14.66 |
5.24 |
15.30 |
11.57 |
0.00 |
29.46 |
70 |
|
Coarse Grains |
9.88 |
1.30 |
1.64 |
0.01 |
3.80 |
0.00 |
35.25 |
195 |
|
|
Rice |
20.34 |
39.17 |
12.84 |
16.31 |
24.06 |
0.11 |
56.82 |
62 |
|
|
Dairy |
12.33 |
11.22 |
27.06 |
26.76 |
17.45 |
5.35 |
33.34 |
52 |
|
|
Meat |
0.48 |
1.09 |
0.31 |
0.17 |
0.58 |
0.04 |
2.62 |
118 |
|
|
Sugar |
32.21 |
20.75 |
36.31 |
31.74 |
29.31 |
9.23 |
57.51 |
46 |
|
|
Fruits and Vegetables |
12.77 |
10.68 |
14.96 |
6.55 |
11.36 |
2.83 |
21.93 |
45 |
|
|
Oils |
1.96 |
1.11 |
1.63 |
3.16 |
1.86 |
0.00 |
10.32 |
109 |
|
|
|
|
|
|
|
|
|
|
![]()
![]()
![]()