![]()
![]()
![]()
|
Mauritania |
Mean |
1970-2001 |
|||||||
|
1970-1979 |
1980-1989 |
1990-1995 |
1996-2001 |
Mean |
Min. |
Max. |
Variation (%) |
||
|
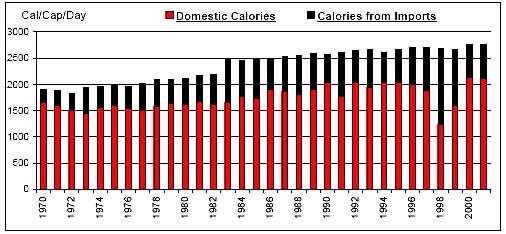
Per Caput Consumption (Cal/Day) |
1968 |
2405 |
2627 |
2716 |
2368 |
1834 |
2764 |
13 |
|
|
Imports / Consumption (%) |
Wheat |
99.08 |
99.65 |
99.72 |
99.85 |
99.52 |
97.37 |
99.94 |
1 |
|
Coarse Grains |
60.42 |
30.85 |
6.67 |
3.23 |
30.38 |
1.22 |
75.42 |
89 |
|
|
Rice |
84.22 |
69.58 |
54.97 |
51.04 |
67.94 |
29.46 |
93.98 |
25 |
|
|
Dairy |
11.40 |
27.77 |
16.99 |
12.80 |
17.83 |
2.13 |
47.11 |
55 |
|
|
Meat |
0.42 |
0.17 |
0.33 |
1.82 |
0.59 |
0.00 |
4.15 |
171 |
|
|
Sugar |
100.00 |
100.00 |
100.00 |
100.00 |
100.00 |
100.00 |
100.00 |
0 |
|
|
Fruits and Vegetables |
22.91 |
35.59 |
45.32 |
45.78 |
35.36 |
10.97 |
57.15 |
36 |
|
|
Oils |
49.19 |
73.65 |
80.26 |
86.72 |
69.70 |
24.30 |
89.18 |
26 |
|
|
Per Caput Calories from Imports (Cal/Cap/Day) |
412 |
654 |
655 |
893 |
623 |
267 |
1465 |
37 |
|
|
Aid + Commercial Food Import Bill (US$ 000) |
42,579 |
105,427 |
112,585 |
155,893 |
96,592 |
11,104 |
236,195 |
50 |
|
|
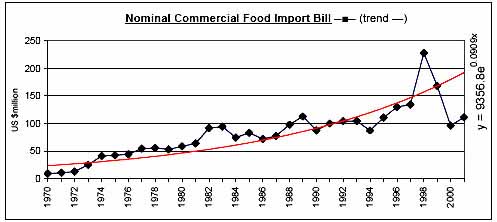
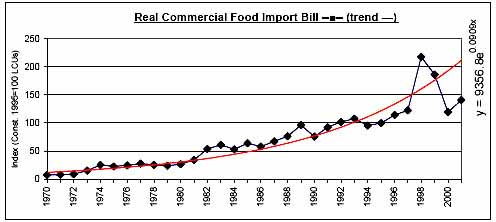
Commercial Food Import Bill (US$ 000) |
35,083 |
82,842 |
99,314 |
144,742 |
82,612 |
9,542 |
227,960 |
55 |
|
|
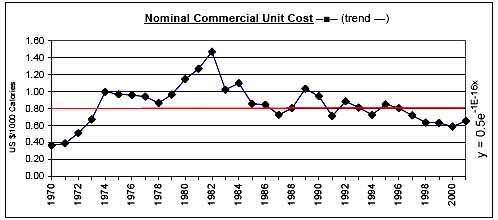
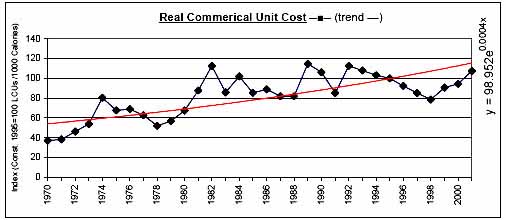
Commerical Unit Cost (US $/1000 calories) |
0.76 |
1.03 |
0.82 |
0.67 |
0.84 |
0.36 |
1.47 |
28 |
|
|
Commercial Food Import Bill / GDP (%) |
5.48 |
9.19 |
8.32 |
9.52 |
7.93 |
1.88 |
15.24 |
36 |
|
|
Comm. Fd. Imp. Bill / Total Merchandise Imp. Bill (%) |
23.82 |
34.73 |
39.84 |
42.91 |
33.81 |
17.08 |
71.53 |
34 |
|
|
Comm. Fd. Imp. Bill / Total Merchandise Exp. Bill (%) |
23.99 |
25.99 |
22.55 |
37.54 |
26.88 |
10.74 |
63.57 |
40 |
|
|
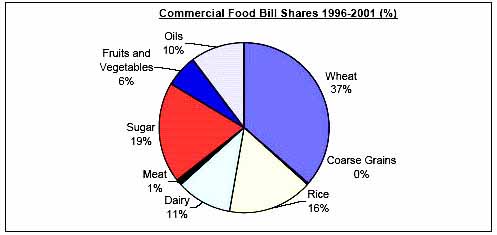
Commercial Food Value Bill Shares (%) |
Wheat |
2.58 |
12.54 |
26.07 |
36.41 |
16.44 |
0.00 |
59.00 |
87 |
|
Coarse Grains |
20.22 |
2.65 |
0.29 |
0.35 |
7.26 |
0.00 |
33.62 |
140 |
|
|
Rice |
11.85 |
20.41 |
14.67 |
16.07 |
15.84 |
0.89 |
31.11 |
38 |
|
|
Dairy |
15.05 |
25.32 |
16.86 |
10.51 |
17.75 |
5.62 |
35.69 |
45 |
|
|
Meat |
0.91 |
0.24 |
0.34 |
1.17 |
0.64 |
0.00 |
3.31 |
133 |
|
|
Sugar |
37.67 |
23.53 |
23.90 |
19.12 |
27.19 |
8.04 |
57.97 |
40 |
|
|
Fruits and Vegetables |
6.86 |
7.91 |
9.87 |
6.23 |
7.63 |
3.45 |
14.81 |
41 |
|
|
Oils |
4.86 |
7.40 |
8.01 |
10.15 |
7.24 |
0.00 |
16.88 |
51 |
|
|
|
|
|
|
|
|
|
|
![]()
![]()
![]()